Description
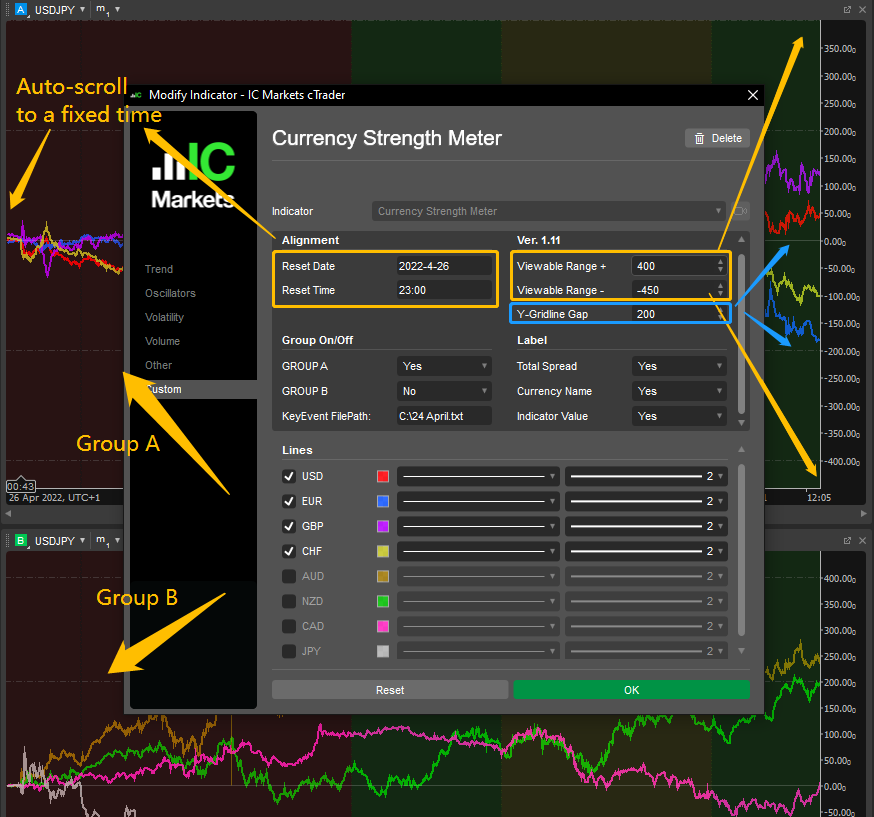
- Group A / B to display 8 major currencies' strengths;
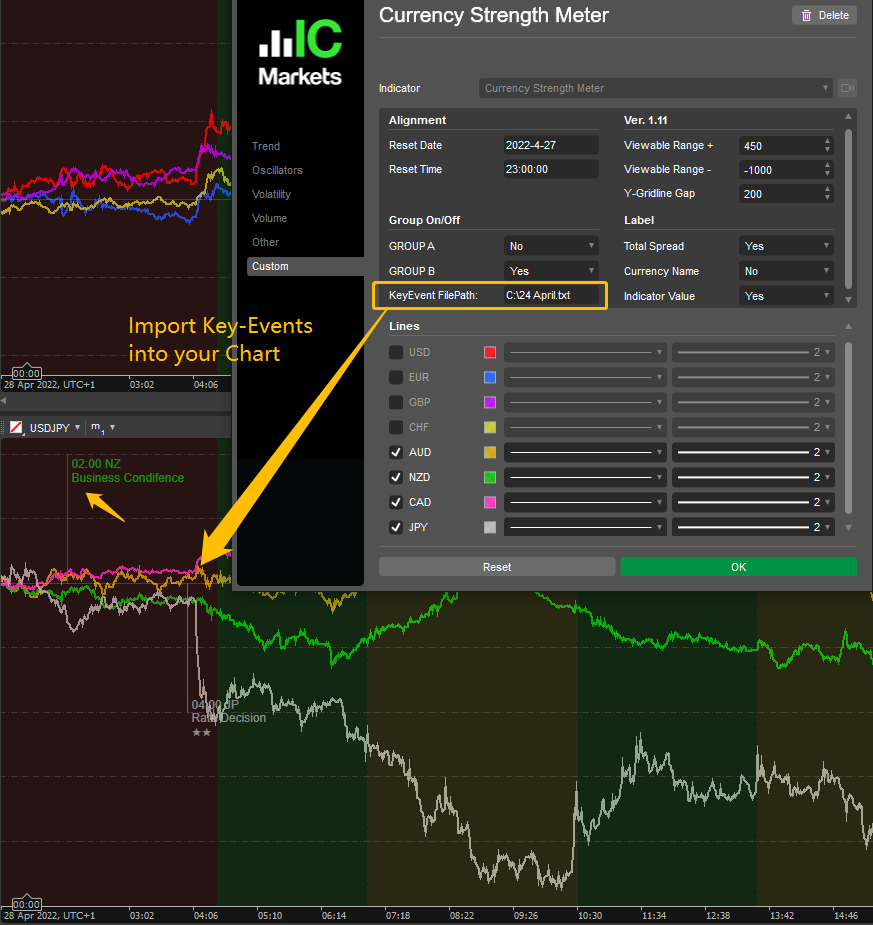
- Import and display Economic KeyEvents (by user time format ±GMT);
- Align all indicators at a setting DateTime (Reset-Time-Point);
- Shift+click scrolling to user-defined Reset-Time-Point;
- Ctrl+click reset viewable Y-Range as settings;
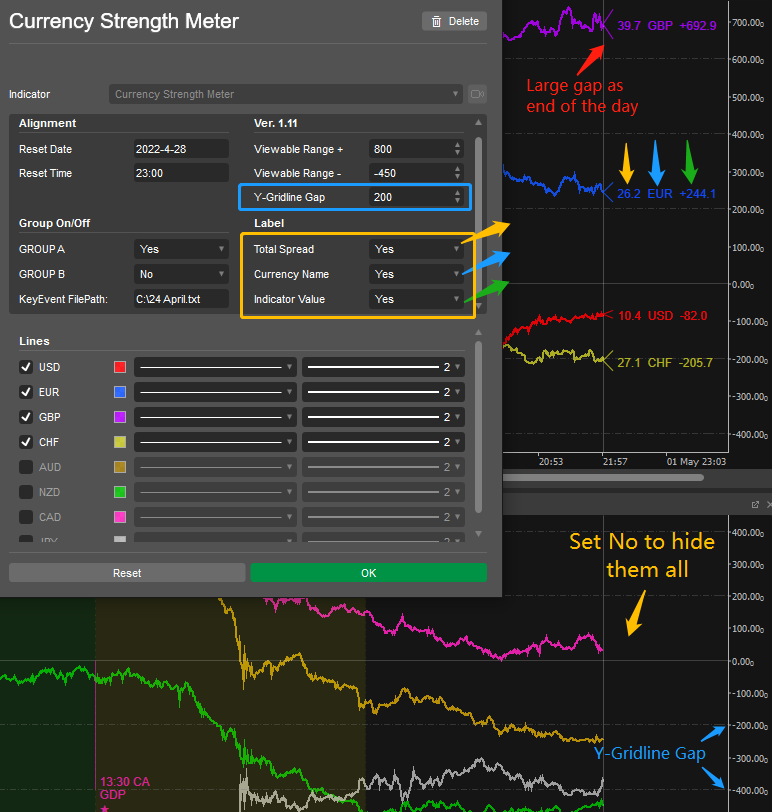
- Labels can display or hide Total Spread, Indicator Name and Value;
- Designed for TimeFrame by time, it also works for other types of TF;
- Framework .NET 6.0 ready, Source code is compatible with .NET 4.0;
Updates: (full logs please see source code)
- v2.20 Add function: Users can set Buffer-Days for preloading history bars;
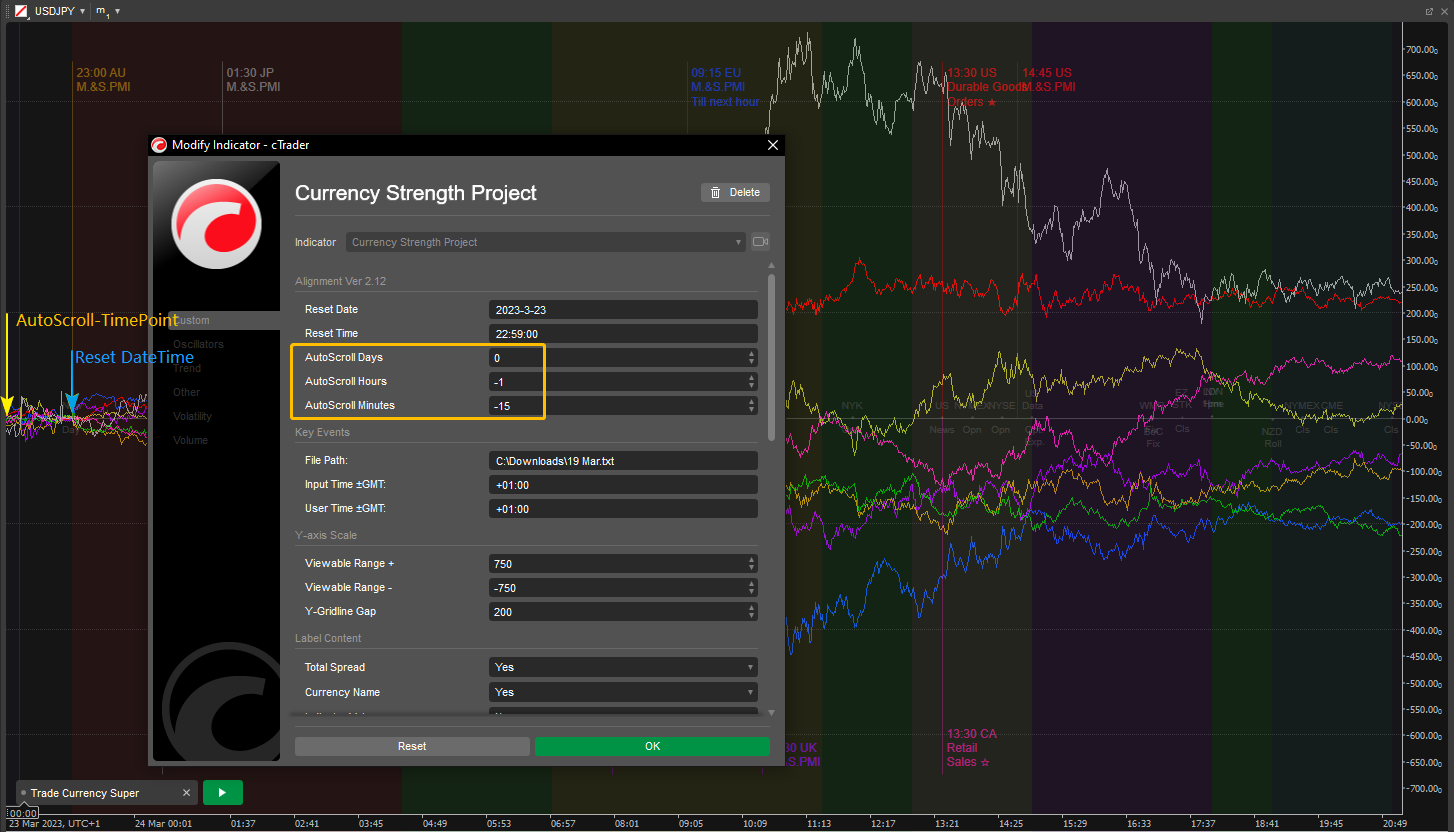
Users can set Y-Value for each indicator at ResetTimePoint; - v2.12 Add function: User can set the timespan gap between AutoScroll-TimePoint and Reset DateTime;
- v2.09 Optimise : Fixed a color code bug when running in cTrader ver 4.5.1;
- v2.08 Add function: User can define KeyEvent's TimeFormat (±GMT); Framework .NET 6.0 ready;
- v2.04 Optimise : Y-Axis Gridline Upper,Lower limits extend to 10000; Other tiny changes;
- v2.03 Add function: Display 5-Minute VerticalGridlines, when chart zooms to 15% or 30%
in TimeFrame-1Minute, zoom back to 5% will be removed;
Optimise : Code Structure (Move repeat constants to readonly variables),
: Auto-load more history data for indicators to display,
: Display KeyEvents up and down in turn to avoid overlapping;
Notes:
- The attachment .algo is compiled by .NET6.0. To run with the old version (4.1.17), please copy the source code and compile it at the cTrader version to fit your environment.
- After v2.08 .NET6 requires full access authorization, you may need to re-authorize the indicator when (re)install;
- Recommend USDJPY as BaseBar in the chart;
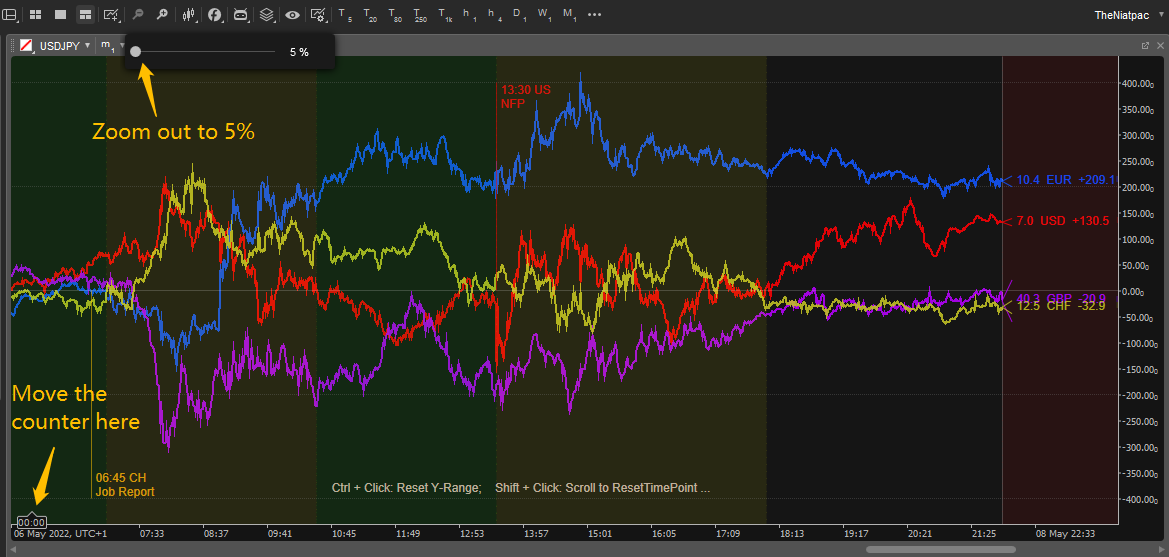
Zoom to 5% for TimeFrame.1Minute as an intraday view, 4Minute for one week view;
Make sure to fill Reset-Time-Point within 1 or 2 days for an intraday chart, within 5-10 days for one week chart; - Economic KeyEvent's txt file in (GMT+1) time can be downloaded every week from the pinned message at Telegram Group: cTrader FOREX Club;
- If you use the group function to display indicators in 2 or more charts, highly recommend it to work with Synchronized ScrZooing which is revised from Spotware's indicators.
Screenshots:
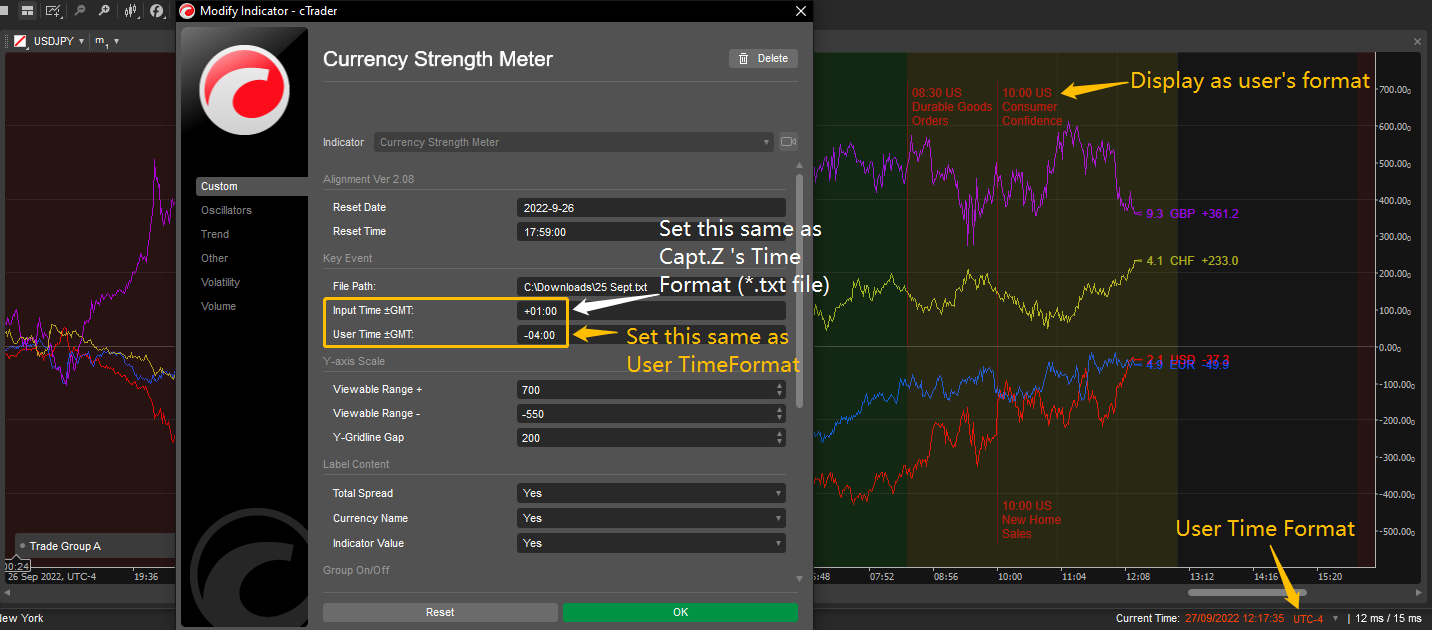
This is a typical setting for intraday use (never mind about the background colour, it's another indicator's performance):
Where you can set file path for economic key events:
Don't forget to set a point of 'Reset Date-Time', and adjust the viewable range when the market moves out of the default setting:
Labels can display Total Spread, Indicator Name and Value, and hide them all by turning the 3 settings off.
Users can define KeyEvent's TimeFormat (±GMT);
Users can set the timespan gap between AutoScroll-TimePoint and Reset DateTime;
 (The new screen chop for Ver 2.20 will be updated later, please kindly noted.)
using System;
using System.IO;
using System.Linq;
using cAlgo.API;
using cAlgo.API.Internals;
#region Version - Header Comments
//v1.01 Basic function;
//v1.02 Add settings: Label Marker with Indicator Name;
//v1.03 Add settings: Fix Viewable Y-Range and Scroll to the ResetTimePoint;
//v1.04 Add settings: Display as Group A,B;
//v1.05 Add settings: Import Economic KeyEvents, Indicator Value to label;
//v1.06 Add settings: Switches of Labels to display Indicator Name and Value;
//v1.07 Add function: Hide BaseBars; Rewrite indicator calcuation;
//v1.08 Update func.: Scrolling to 15 minutes before the ResetTimePoint (AutoScrollPoint);
//v1.09 Add settings: Y-Axis Gridline Gap (set 0 to hide); Viewable Y-Range set 0,0 to unlocking;
// Add function: Turn off both Indicator Name and Value to hide LabelMarker; Adjust Label format Indicator Value (+0.0 -0.0);
//v1.10 Optimise : Indicators calculation and add 'Pips-Value' factor to the calculation of indicator value, based on GBP prices at ResetTimePoint;
//v1.11 Add settings: Label to display Total Spread of EachCurrency, and size the gap of LabelMarker by TotalSpreadValue;
// Add function: Y-Axis Gridline Gap: 0 to disable chart scrolling;
//v2.01 Add function: Shift + MouseClick on chart to scroll to AutoScrollPoint;
// Update func.: Reset Viewable Y-Range is effective when Y-Axis Gridline Gap > 0,
// and triggered by launching the indicator or Ctrl + MouseClick on chart;
// Optimise : Displaying of Label, Calculation of TotalSpread (0.5 error);
//v2.02 Optimise : Indicators calculation, Displaying of Label and Code Structure;
//v2.03 Add function: Display 5-Minute VerticalGridlines, when chart zooms to 15% or 30% in TimeFrame-1Minute, zoom back to 5% will be removed;
// Optimise : Code Structure (Move repeat constants to readonly variables),
// : Auto-load more history data for indicators to display,
// : Display KeyEvents up and down in turn to avoid overlapping;
//v2.04 Optimise : Y-Axis Gridline Upper,Lower limits extend to 10000; Code Structure(tiny changes);
//v2.05 ~ 2.07 : Optimise SpreadGapPointer's Length; Debug Framework.Net6;
//v2.08 Add function: User can define KeyEvent's TimeFormat (±GMT); Framework .NET 6.0 ready;
//v2.09 Optimise : Fixed a color code bug when running in cTrader ver 4.5.1;
//v2.10 ~ v2.11 : ...Internal test...
//v2.12 Add function: User can set the timespan gap between AutoScroll-TimePoint and Reset DateTime;
//v2.20 (2024.06.06):
// Add Function: Buffer Days for preloading history bars;
// Add FUnction: Y-Value can be customised at ResetTimePoint;
// Optimise : PipsValue-Ratio calculation on both HistoryBars and LastBar;
#endregion
namespace cAlgo
{
[Indicator(IsOverlay = true, TimeZone = TimeZones.UTC, AccessRights = AccessRights.FullAccess)]
public class CurrencyStrengthMeter : Indicator
{
#region Initialize, Calculate and Controls
protected override void Initialize()
{
//0.Initialize LoadingMessage Text; Add LoadingMessage to Chart; [Pro Version]
s_TFNm = "_" + Chart.TimeFrame.Name.ToString(); b_TickGroup = s_TFNm.Contains("Tick");
b_TimeGroup = s_TFNm.Contains("Minute") || s_TFNm.Contains("Hour") || s_TFNm.Contains("Day") || s_TFNm.Contains("Week") || s_TFNm.Contains("Month");
tx_Load.Text = (YxisGap==0) ? act_ScD : act_Rdy; Chart.AddControl(tx_Load);
// * * * * * * * * * * * * * * * * * * * * * * * * * Basic Version * * * * * * * * * * * * * * * * * * * * * * * * * //
//1.BasicParameters and Bars for EachSymbol
dt_DispBf = Server.Time.AddYears(10); //Pause Calculate() before EverythingReady
BarsD1 = MarketData.GetBars(TimeFrame.Daily, Bars.SymbolName); //Get DailyBars as same ChartSymbol
bool result = DateTime.TryParse(ResetDate +(char)32+ ResetTime, out DateTime dt_Parse); //Handle when inputing ResetDateTime
if (result) { dt_RstPnt=dt_Parse.Add(-Application.UserTimeOffset); //Convert ResetTimePoint to ServerTime
dt_RstPnt=dt_RstPnt>Server.Time?Server.Time:dt_RstPnt; } //Future ResetTimePoint convert to ServerTimeNow
else { return; } //Input-Error Alert, Pause further working
dt_AtoScr = dt_RstPnt.AddDays(AtScDay).AddHours(AtScHrs).AddMinutes(AtScMin); //Get AutoScroll-TimePoint [Pro Version]
while ( Bars[0].OpenTime >dt_RstPnt.AddDays(DsBfDay-1) ) { Bars .LoadMoreHistory(); } //MakeSure Bars has enough history data
while ( BarsD1[0].OpenTime>dt_RstPnt.AddDays(DsBfDay-1) ) { BarsD1.LoadMoreHistory(); } //MakeSure BarsD1 has enough history data
int i_RstDay = BarsD1.OpenTimes.GetIndexByTime(dt_RstPnt); //Get DailyBars index of ResetTimePoint
dt_DispBf = BarsD1[i_RstDay+DsBfDay].OpenTime; //Get DisplayBuffer DateTime: X TradingDay before ResetTimePoint as default;
GetBarsForEachSymbols(Bars.TimeFrame); //a.Load Bars for EachSymbol by Bar.TimeFrame //
UpdateSymbolsIndex(dt_RstPnt); //b.Move Index (in_) to ResetTimePoint for EachSymbol//
GetClosePricesAtResetPoint(); //c.Load ClosePrices of EachSymbols at ResetTimePoint//
//
//2.Chart DisplaySettings
Chart.ColorSettings.BullFillColor = Color.Transparent; Chart.ColorSettings.BullOutlineColor = Color.Transparent; //Hide Bars(Bull) in Chart
Chart.ColorSettings.BearFillColor = Color.Transparent; Chart.ColorSettings.BearOutlineColor = Color.Transparent; //Hide Bars(Bear) in Chart
// = = = = = = = = = = = = = = = = = = = = = = = = = Basic Version = = = = = = = = = = = = = = = = = = = = = = = = = //
// * * * * * * * * * * * * * * * * * * * * * * * * * Pro Version * * * * * * * * * * * * * * * * * * * * * * * * * * //
//3.Chart Display (Don't Zoom, cause problem when loading LongTimeFrame Bars)
b_YRange = ( MVRange!=0 && PVRange!=0 ); ChartYGrid(); ChartXGrid(); DrawAllEvents(); //Viewable Y-Range ±(0/0 to Disable); Draw Gridlines; Draw KeyEvent's Label of EachCurrency
if (YxisGap> 0) { Chart.ScrollXTo(dt_AtoScr); if (b_YRange) { Chart.SetYRange(MVRange, PVRange); } } // > 0: Enable ResetTimePoint-Scrolling, Reset Viewable Y-Range
else if (YxisGap==0) { Chart.IsScrollingEnabled = false; } // = 0: Hide GridLines, Disable ChartScrolling, ResetTimePoint-Scrolling and Y-RangeReseting;
else { YxisGap = 200; } // < 0: Set 200 as default GridLinesGap, Disable Chart Y-Range Reseting;
//
//4.Initialize Label(On,Off) Marker's Parameter and ForePartText
LabelColor(); DefineLabelMarkerLength(); //Define: LabelColor, MarkerLength: Zoom5% 12 bars, 15% 4 bars, 30% 2 bars, others 3 bars;
LastBarsGroupA(Bars.Count-1); LastBarsGroupB(Bars.Count-1); //Update Indicators' value at LastBar (Bars.Count-1)
if (NmMrkr) { m_US=n_US; m_EU=n_EU; m_GB=n_GB; m_CH=n_CH; m_AU=n_AU; m_NZ=n_NZ; m_CA=n_CA; m_JP=n_JP+nSp;} //a.Load Currencys Name (JPY have a space)
if (SprdSm) { UpdateSymbolsSpreads(); SpreadTextGroupA(); SpreadTextGroupB(); } //b.Load Currencys TotalSpread
//
//5.Add ChartEvent's Controls
Chart.MouseDown += Chart_MouseDown; //Reset Viewable-YRange(Ctrl+Click), Scroll to ResetTimePoint(Shift+Click); Clear Loading Message;
Chart.ZoomChanged += Chart_ZoomChanged; //Reset Length of LabelMarker
// = = = = = = = = = = = = = = = = = = = = = = = = = Pro Version = = = = = = = = = = = = = = = = = = = = = = = = = = //
}
public override void Calculate(int index)
{
//1.Calculation only start from AutoScroll Point
if (b_BfrRstPnt) {if (Bars.OpenTimes[index] < dt_DispBf) { return; } else { b_BfrRstPnt = false; } } //[BasicVersion]
//2.Calculate LastBar
if (IsLastBar)
{
LastBarPVR(); //Get PipsValue-Ratio for LastBar //[BasicVersion]
if (GroupA) //GroupA:
{ LastBarsGroupA(index); // Calculate indicator value, at LastBarClose of relevant symbols //[BasicVersion]
if (SprdSm) { UpdateSymbolsSpreads(); SpreadTextGroupA(); } // Get TotalSpreads value and text for EachCurrency //[Pro Version]
if (DiMrkr) { ValueTextGroupA(index); } // Get text of IndicatorValue for EachCurrency //[Pro Version]
DrawLabelForePartGroupA(index, index+i_LblMkrLth); // Update Labels for EachCurrency //[Pro Version]
}
if (GroupB) //GroupB:
{ LastBarsGroupB(index); // Calculate indicator value, at LastBarClose of relevant symbols //[BasicVersion]
if (SprdSm) { UpdateSymbolsSpreads(); SpreadTextGroupB(); } // Get TotalSpreads value and text for EachCurrency //[Pro Version]
if (DiMrkr) { ValueTextGroupB(index); } // Get text of IndicatorValue for EachCurrency //[Pro Version]
DrawLabelForePartGroupB(index, index+i_LblMkrLth); // Update Labels for EachCurrency //[Pro Version]
}
}
//3.Calculate History Bars
else
{
UpdateSymbolsIndex(Bars.OpenTimes[index]); //Get HistoryBar's Index# for EachSymbols //[BasicVersion]
HistoryPVR(); //Get PipsValue-Ratio for history bars(as BarClosed value) //[ ... ... ]
if (GroupA) HistoryBarsGroupA(index); //GroupA: Calculate indicator value, at HistoryBar of relevant symbols //[ ... ... ]
if (GroupB) HistoryBarsGroupB(index); //GroupB: Calculate indicator value, at HistoryBar of relevant symbols //[BasicVersion]
}
}
private void Chart_MouseDown(ChartMouseEventArgs obj) // ChartControl - ClickMouse
{
tx_Load.Text = string.Empty; // Clear Loading Message; [Pro Version]
if ( obj.CtrlKey && b_YRange) { Chart.SetYRange(MVRange, PVRange); } // Ctrl + ClickChart: Reset ViewableRange(Y) as settings; [ .. ... ]
if ( obj.ShiftKey ) { Chart.ScrollXTo(dt_AtoScr); } // Shift + ClickChart: AutoScroll to ResetTimePoint; [Pro Version]
}
private void Chart_ZoomChanged(ChartZoomEventArgs obj) // ChartControl - ZoomChange
{
DefineLabelMarkerLength(); int idx = Bars.Count-1; //Redefine LabelMarker's length and Index to Draw Labels; [Pro Version]
if (GroupA) //GroupA: [ .. ... ]
{ LastBarsGroupA(idx); // Calculate indicator value, at LastBarClose of relevant symbols [ .. ... ]
if (SprdSm) { UpdateSymbolsSpreads(); SpreadTextGroupA(); } // Get TotalSpreads value and text for EachCurrency [ .. ... ]
if (DiMrkr) { ValueTextGroupA(idx); } // Get text of IndicatorValue for EachCurrency [ .. ... ]
DrawLabelForePartGroupA(idx, idx+i_LblMkrLth); // Update Labels for EachCurrency [ .. ... ]
} // [ .. ... ]
if (GroupB) //GroupB: [ .. ... ]
{ LastBarsGroupB(idx); // Calculate indicator value, at LastBarClose of relevant symbols [ .. ... ]
if (SprdSm) { UpdateSymbolsSpreads(); SpreadTextGroupB(); } // Get TotalSpreads value and text for EachCurrency [ .. ... ]
if (DiMrkr) { ValueTextGroupB(idx); } // Get text of IndicatorValue for EachCurrency [ .. ... ]
DrawLabelForePartGroupB(idx, idx+i_LblMkrLth); // Update Labels for EachCurrency [ .. ... ]
} // [ .. ... ]
ChartXGrid(); //Set Vertidal Lines of 5-Minutes; [ .. ... ]
tx_Load.Text = act_zmm + Chart.ZoomLevel.ToString() + Emp; //Popup message zoom level changed to %; [Pro Version]
}
#endregion
#region Basic Version (Parameters, Definition and Functions)
// * * * * * * * * * * * * * * * * * * * * * * * * * Basic Version * * * * * * * * * * * * * * * * * * * * * * * * * //
[Parameter("Reset Date", DefaultValue="2030-12-31", Group="Ver. 2.20" )] public string ResetDate { get; set; }
[Parameter("Reset Time", DefaultValue="22:59:00", Group="Ver. 2.20" )] public string ResetTime { get; set; }
[Parameter("GROUP A", DefaultValue="True", Group="Ver. 2.20" )] public bool GroupA { get; set; }
[Parameter("GROUP B", DefaultValue="True", Group="Ver. 2.20" )] public bool GroupB { get; set; }
[Parameter("Buffer Days (-999~0)", DefaultValue=0, MinValue=-999, MaxValue=0, Step =-1, Group="Ver. 2.20" )] public int DsBfDay { get; set; } //DataBuffer(Days) - v2.20
//Y-Value Adjustment
[Parameter("USD", DefaultValue=0, MinValue=-999, MaxValue=999, Step =1, Group="Y-Value Adjustment at ResetTimePoint ( ±999 )")] public double Y_US { get; set; } //Adjustment Y-Value USD - v2.20
[Parameter("EUR", DefaultValue=0, MinValue=-999, MaxValue=999, Step =1, Group="Y-Value Adjustment at ResetTimePoint ( ±999 )")] public double Y_EU { get; set; } //Adjustment Y-Value EUR ...
[Parameter("GBP", DefaultValue=0, MinValue=-999, MaxValue=999, Step =1, Group="Y-Value Adjustment at ResetTimePoint ( ±999 )")] public double Y_GB { get; set; } //Adjustment Y-Value GBP ...
[Parameter("CHF", DefaultValue=0, MinValue=-999, MaxValue=999, Step =1, Group="Y-Value Adjustment at ResetTimePoint ( ±999 )")] public double Y_CH { get; set; } //Adjustment Y-Value CHF ...
[Parameter("AUD", DefaultValue=0, MinValue=-999, MaxValue=999, Step =1, Group="Y-Value Adjustment at ResetTimePoint ( ±999 )")] public double Y_AU { get; set; } //Adjustment Y-Value AUD ...
[Parameter("NZD", DefaultValue=0, MinValue=-999, MaxValue=999, Step =1, Group="Y-Value Adjustment at ResetTimePoint ( ±999 )")] public double Y_NZ { get; set; } //Adjustment Y-Value NZD ...
[Parameter("CAD", DefaultValue=0, MinValue=-999, MaxValue=999, Step =1, Group="Y-Value Adjustment at ResetTimePoint ( ±999 )")] public double Y_CA { get; set; } //Adjustment Y-Value CAD ...
[Parameter("JPY", DefaultValue=0, MinValue=-999, MaxValue=999, Step =1, Group="Y-Value Adjustment at ResetTimePoint ( ±999 )")] public double Y_JP { get; set; } //Adjustment Y-Value JPY ...
//Output and IndicatorColors
[Output("USD", LineColor="#DDFF0005", Thickness=1, PlotType=PlotType.DiscontinuousLine)] public IndicatorDataSeries USD { get; set; } private static readonly Color cl_USD=Color.FromHex("#DDFF0005");
[Output("EUR", LineColor="#DD1256FF", Thickness=1, PlotType=PlotType.DiscontinuousLine)] public IndicatorDataSeries EUR { get; set; } private static readonly Color cl_EUR=Color.FromHex("#DD1256FF");
[Output("GBP", LineColor="#DDB600FF", Thickness=1, PlotType=PlotType.DiscontinuousLine)] public IndicatorDataSeries GBP { get; set; } private static readonly Color cl_GBP=Color.FromHex("#DDB600FF");
[Output("CHF", LineColor="#DDC4C425", Thickness=1, PlotType=PlotType.DiscontinuousLine)] public IndicatorDataSeries CHF { get; set; } private static readonly Color cl_CHF=Color.FromHex("#DDC4C425");
[Output("AUD", LineColor="#DDCFA005", Thickness=1, PlotType=PlotType.DiscontinuousLine)] public IndicatorDataSeries AUD { get; set; } private static readonly Color cl_AUD=Color.FromHex("#DDCFA005");
[Output("NZD", LineColor="#DD00BF00", Thickness=1, PlotType=PlotType.DiscontinuousLine)] public IndicatorDataSeries NZD { get; set; } private static readonly Color cl_NZD=Color.FromHex("#DD00BF00");
[Output("CAD", LineColor="#DDFF21BF", Thickness=1, PlotType=PlotType.DiscontinuousLine)] public IndicatorDataSeries CAD { get; set; } private static readonly Color cl_CAD=Color.FromHex("#DDFF21BF");
[Output("JPY", LineColor="#DDB3B3B3", Thickness=1, PlotType=PlotType.DiscontinuousLine)] public IndicatorDataSeries JPY { get; set; } private static readonly Color cl_JPY=Color.FromHex("#DDB3B3B3");
//Symbol Names
private readonly string s_EURUSD="EURUSD", s_EURGBP="EURGBP", s_EURAUD="EURAUD", s_EURNZD="EURNZD", s_EURCAD="EURCAD", s_EURCHF="EURCHF", s_EURJPY="EURJPY";
private readonly string s_GBPUSD="GBPUSD", s_GBPAUD="GBPAUD", s_GBPNZD="GBPNZD", s_GBPCAD="GBPCAD", s_GBPCHF="GBPCHF", s_GBPJPY="GBPJPY";
private readonly string s_AUDUSD="AUDUSD", s_AUDNZD="AUDNZD", s_AUDCAD="AUDCAD", s_AUDCHF="AUDCHF", s_AUDJPY="AUDJPY";
private readonly string s_NZDUSD="NZDUSD", s_NZDCAD="NZDCAD", s_NZDCHF="NZDCHF", s_NZDJPY="NZDJPY";
private readonly string s_USDCAD="USDCAD", s_CADCHF="CADCHF", s_CADJPY="CADJPY";
private readonly string s_USDCHF="USDCHF", s_CHFJPY="CHFJPY";
private readonly string s_USDJPY="USDJPY";
//Bars to load for Calculate : Defined at Initialize()
private Bars EURUSD, EURGBP, EURAUD, EURNZD, EURCAD, EURCHF, EURJPY;
private Bars GBPUSD, GBPAUD, GBPNZD, GBPCAD, GBPCHF, GBPJPY;
private Bars AUDUSD, AUDNZD, AUDCAD, AUDCHF, AUDJPY;
private Bars NZDUSD, NZDCAD, NZDCHF, NZDJPY;
private Bars USDCAD, CADCHF, CADJPY;
private Bars USDCHF, CHFJPY;
private Bars USDJPY;
//Index at OpenTime of LastBar of EachSymbol : Defined at Initialize() & Calculate()
private int in_EURUSD, in_EURGBP, in_EURAUD, in_EURNZD, in_EURCAD, in_EURCHF, in_EURJPY;
private int in_GBPUSD, in_GBPAUD, in_GBPNZD, in_GBPCAD, in_GBPCHF, in_GBPJPY;
private int in_AUDUSD, in_AUDNZD, in_AUDCAD, in_AUDCHF, in_AUDJPY;
private int in_NZDUSD, in_NZDCAD, in_NZDCHF, in_NZDJPY;
private int in_USDCAD, in_CADCHF, in_CADJPY;
private int in_USDCHF, in_CHFJPY;
private int in_USDJPY;
//OpenPrice at ResetTimePoint of EachSymbol : Defined at Initialize()
private double db_EURUSD, db_EURGBP, db_EURAUD, db_EURNZD, db_EURCAD, db_EURCHF, db_EURJPY;
private double db_GBPUSD, db_GBPAUD, db_GBPNZD, db_GBPCAD, db_GBPCHF, db_GBPJPY;
private double db_AUDUSD, db_AUDNZD, db_AUDCAD, db_AUDCHF, db_AUDJPY;
private double db_NZDUSD, db_NZDCAD, db_NZDCHF, db_NZDJPY;
private double db_USDCAD, db_CADCHF, db_CADJPY;
private double db_USDCHF, db_CHFJPY;
private double db_USDJPY;
//Parameters for Calculate Indicators : Defined at Initialize()
private bool b_BfrRstPnt=true; // Switch (True: return if index before AutoScroll TimePoint);
private double mp_NJp=10000, mp_YJp=100; // Pips Decimal Convertor
private double G_GBP=1, G_USD, G_AUD, G_NZD, G_CAD, G_CHF, G_JPY; // PipsValue-Ratio (Adjustment of EachSymbol's contribution to Indicators, ...
//Parameters for Displaysetting: Defined at Initialize() ... based on GBP prices at a given BarIndex, no G_EUR: as NoSymbol is priced by EUR)
private Bars BarsD1; // DailyBars as same ChartBarsSymbol;
private DateTime dt_RstPnt; // Reset TimePoint, Auto-Scroll TimePoint
private DateTime dt_DispBf; // Display Buffer(1 TradingDay ahead of ResetTimePoint);
// * * * * * * * * * * * * * * * * * * * * * * * * * Basic Version * * * * * * * * * * * * * * * * * * * * * * * * * //
// * * * * * * * * * * * * * * * * * * * * * * * * * Basic Version * * * * * * * * * * * * * * * * * * * * * * * * * //
private void GetBarsForEachSymbols(TimeFrame timeFrame) //GetBars for EachSymbol
{
EURUSD = MarketData.GetBars(timeFrame, s_EURUSD); GBPUSD = MarketData.GetBars(timeFrame, s_GBPUSD); AUDUSD = MarketData.GetBars(timeFrame, s_AUDUSD); NZDUSD = MarketData.GetBars(timeFrame, s_NZDUSD);
EURGBP = MarketData.GetBars(timeFrame, s_EURGBP); GBPAUD = MarketData.GetBars(timeFrame, s_GBPAUD); AUDNZD = MarketData.GetBars(timeFrame, s_AUDNZD); NZDCAD = MarketData.GetBars(timeFrame, s_NZDCAD);
EURAUD = MarketData.GetBars(timeFrame, s_EURAUD); GBPNZD = MarketData.GetBars(timeFrame, s_GBPNZD); AUDCAD = MarketData.GetBars(timeFrame, s_AUDCAD); NZDCHF = MarketData.GetBars(timeFrame, s_NZDCHF);
EURNZD = MarketData.GetBars(timeFrame, s_EURNZD); GBPCAD = MarketData.GetBars(timeFrame, s_GBPCAD); AUDCHF = MarketData.GetBars(timeFrame, s_AUDCHF); NZDJPY = MarketData.GetBars(timeFrame, s_NZDJPY);
EURCAD = MarketData.GetBars(timeFrame, s_EURCAD); GBPCHF = MarketData.GetBars(timeFrame, s_GBPCHF); AUDJPY = MarketData.GetBars(timeFrame, s_AUDJPY);
EURCHF = MarketData.GetBars(timeFrame, s_EURCHF); GBPJPY = MarketData.GetBars(timeFrame, s_GBPJPY); USDCAD = MarketData.GetBars(timeFrame, s_USDCAD);
EURJPY = MarketData.GetBars(timeFrame, s_EURJPY); USDCHF = MarketData.GetBars(timeFrame, s_USDCHF); CADCHF = MarketData.GetBars(timeFrame, s_CADCHF);
USDJPY = MarketData.GetBars(timeFrame, s_USDJPY); CHFJPY = MarketData.GetBars(timeFrame, s_CHFJPY); CADJPY = MarketData.GetBars(timeFrame, s_CADJPY);
//Check History Length to load more
while ( EURUSD[0].OpenTime > dt_DispBf) { EURUSD.LoadMoreHistory(); } while ( GBPUSD[0].OpenTime > dt_DispBf) { GBPUSD.LoadMoreHistory(); } while ( AUDUSD[0].OpenTime > dt_DispBf) { AUDUSD.LoadMoreHistory(); }
while ( EURGBP[0].OpenTime > dt_DispBf) { EURGBP.LoadMoreHistory(); } while ( GBPAUD[0].OpenTime > dt_DispBf) { GBPAUD.LoadMoreHistory(); } while ( AUDNZD[0].OpenTime > dt_DispBf) { AUDNZD.LoadMoreHistory(); }
while ( EURAUD[0].OpenTime > dt_DispBf) { EURAUD.LoadMoreHistory(); } while ( GBPNZD[0].OpenTime > dt_DispBf) { GBPNZD.LoadMoreHistory(); } while ( AUDCAD[0].OpenTime > dt_DispBf) { AUDCAD.LoadMoreHistory(); }
while ( EURNZD[0].OpenTime > dt_DispBf) { EURNZD.LoadMoreHistory(); } while ( GBPCAD[0].OpenTime > dt_DispBf) { GBPCAD.LoadMoreHistory(); } while ( AUDCHF[0].OpenTime > dt_DispBf) { AUDCHF.LoadMoreHistory(); }
while ( EURCAD[0].OpenTime > dt_DispBf) { EURCAD.LoadMoreHistory(); } while ( GBPCHF[0].OpenTime > dt_DispBf) { GBPCHF.LoadMoreHistory(); } while ( AUDJPY[0].OpenTime > dt_DispBf) { AUDJPY.LoadMoreHistory(); }
while ( EURCHF[0].OpenTime > dt_DispBf) { EURCHF.LoadMoreHistory(); } while ( GBPJPY[0].OpenTime > dt_DispBf) { GBPJPY.LoadMoreHistory(); }
while ( EURJPY[0].OpenTime > dt_DispBf) { EURJPY.LoadMoreHistory(); }
while ( NZDUSD[0].OpenTime > dt_DispBf) { NZDUSD.LoadMoreHistory(); } while ( USDCAD[0].OpenTime > dt_DispBf) { USDCAD.LoadMoreHistory(); } while ( USDCHF[0].OpenTime > dt_DispBf) { USDCHF.LoadMoreHistory(); }
while ( NZDCAD[0].OpenTime > dt_DispBf) { NZDCAD.LoadMoreHistory(); } while ( CADCHF[0].OpenTime > dt_DispBf) { CADCHF.LoadMoreHistory(); } while ( CHFJPY[0].OpenTime > dt_DispBf) { CHFJPY.LoadMoreHistory(); }
while ( NZDCHF[0].OpenTime > dt_DispBf) { NZDCHF.LoadMoreHistory(); } while ( CADJPY[0].OpenTime > dt_DispBf) { CADJPY.LoadMoreHistory(); }
while ( NZDJPY[0].OpenTime > dt_DispBf) { NZDJPY.LoadMoreHistory(); } while ( USDJPY[0].OpenTime > dt_DispBf) { USDJPY.LoadMoreHistory(); }
}
private void UpdateSymbolsIndex(DateTime dateTime) //Update Index for EachSymbol at a GivenDateTime (HistoryBars)
{
in_EURUSD = EURUSD.OpenTimes.GetIndexByTime(dateTime); in_GBPUSD = GBPUSD.OpenTimes.GetIndexByTime(dateTime); in_AUDUSD = AUDUSD.OpenTimes.GetIndexByTime(dateTime); in_NZDUSD = NZDUSD.OpenTimes.GetIndexByTime(dateTime);
in_EURGBP = EURGBP.OpenTimes.GetIndexByTime(dateTime); in_GBPAUD = GBPAUD.OpenTimes.GetIndexByTime(dateTime); in_AUDCAD = AUDCAD.OpenTimes.GetIndexByTime(dateTime); in_NZDCAD = NZDCAD.OpenTimes.GetIndexByTime(dateTime);
in_EURAUD = EURAUD.OpenTimes.GetIndexByTime(dateTime); in_GBPCAD = GBPCAD.OpenTimes.GetIndexByTime(dateTime); in_AUDNZD = AUDNZD.OpenTimes.GetIndexByTime(dateTime); in_NZDCHF = NZDCHF.OpenTimes.GetIndexByTime(dateTime);
in_EURCAD = EURCAD.OpenTimes.GetIndexByTime(dateTime); in_GBPNZD = GBPNZD.OpenTimes.GetIndexByTime(dateTime); in_AUDCHF = AUDCHF.OpenTimes.GetIndexByTime(dateTime); in_NZDJPY = NZDJPY.OpenTimes.GetIndexByTime(dateTime);
in_EURNZD = EURNZD.OpenTimes.GetIndexByTime(dateTime); in_GBPCHF = GBPCHF.OpenTimes.GetIndexByTime(dateTime); in_AUDJPY = AUDJPY.OpenTimes.GetIndexByTime(dateTime);
in_EURCHF = EURCHF.OpenTimes.GetIndexByTime(dateTime); in_GBPJPY = GBPJPY.OpenTimes.GetIndexByTime(dateTime); in_USDCAD = USDCAD.OpenTimes.GetIndexByTime(dateTime);
in_EURJPY = EURJPY.OpenTimes.GetIndexByTime(dateTime); in_USDCHF = USDCHF.OpenTimes.GetIndexByTime(dateTime); in_CADCHF = CADCHF.OpenTimes.GetIndexByTime(dateTime);
in_USDJPY = USDJPY.OpenTimes.GetIndexByTime(dateTime); in_CHFJPY = CHFJPY.OpenTimes.GetIndexByTime(dateTime); in_CADJPY = CADJPY.OpenTimes.GetIndexByTime(dateTime);
}
private void GetClosePricesAtResetPoint() //Get ClosePrices of EachSymbols at ResetTimePoint
{
db_EURUSD = EURUSD[in_EURUSD].Close; db_GBPUSD = GBPUSD[in_GBPUSD].Close; db_AUDUSD = AUDUSD[in_AUDUSD].Close; db_NZDUSD = NZDUSD[in_NZDUSD].Close;
db_EURGBP = EURGBP[in_EURGBP].Close; db_GBPAUD = GBPAUD[in_GBPAUD].Close; db_AUDCAD = AUDCAD[in_AUDCAD].Close; db_NZDCAD = NZDCAD[in_NZDCAD].Close;
db_EURAUD = EURAUD[in_EURAUD].Close; db_GBPCAD = GBPCAD[in_GBPCAD].Close; db_AUDNZD = AUDNZD[in_AUDNZD].Close; db_NZDCHF = NZDCHF[in_NZDCHF].Close;
db_EURCAD = EURCAD[in_EURCAD].Close; db_GBPNZD = GBPNZD[in_GBPNZD].Close; db_AUDCHF = AUDCHF[in_AUDCHF].Close; db_NZDJPY = NZDJPY[in_NZDJPY].Close;
db_EURNZD = EURNZD[in_EURNZD].Close; db_GBPCHF = GBPCHF[in_GBPCHF].Close; db_AUDJPY = AUDJPY[in_AUDJPY].Close;
db_EURCHF = EURCHF[in_EURCHF].Close; db_GBPJPY = GBPJPY[in_GBPJPY].Close; db_USDCAD = USDCAD[in_USDCAD].Close;
db_EURJPY = EURJPY[in_EURJPY].Close; db_USDCHF = USDCHF[in_USDCHF].Close; db_CADCHF = CADCHF[in_CADCHF].Close;
db_USDJPY = USDJPY[in_USDJPY].Close; db_CHFJPY = CHFJPY[in_CHFJPY].Close; db_CADJPY = CADJPY[in_CADJPY].Close;
}
private void LastBarPVR() //Last Bar to get PipsValue-Ratio (Adjustment of EachSymbol's contribution to Indicators, based on GBP prices at LastBarIndex , no G_EUR: as NoSymbol is priced by EUR)
{ G_USD=1/GBPUSD.LastBar.Close; G_AUD=1/GBPAUD.LastBar.Close; G_NZD=1/GBPNZD.LastBar.Close; G_CAD=1/GBPCAD.LastBar.Close; G_CHF=1/GBPCHF.LastBar.Close; G_JPY=100/GBPJPY.LastBar.Close; }
private void HistoryPVR() //HistoryBars get PipsValue-Ratio (Adjustment of EachSymbol's contribution to Indicators, based on GBP prices at BarIndex(in_XXXXXX), no G_EUR: as NoSymbol is priced by EUR)
{ G_USD=1/GBPUSD[in_GBPUSD].Close; G_AUD=1/GBPAUD[in_GBPAUD].Close; G_NZD=1/GBPNZD[in_GBPNZD].Close; G_CAD=1/GBPCAD[in_GBPCAD].Close; G_CHF=1/GBPCHF[in_GBPCHF].Close; G_JPY=100/GBPJPY[in_GBPJPY].Close; }
private void HistoryBarsGroupA(int idx) //Update Indicator-History-Value - [Group A]
{
EUR[idx] = Y_EU + ( ( (EURUSD[in_EURUSD].Close-db_EURUSD)*G_USD + (EURGBP[in_EURGBP].Close-db_EURGBP)*G_GBP + (EURAUD[in_EURAUD].Close-db_EURAUD)*G_AUD + (EURNZD[in_EURNZD].Close-db_EURNZD)*G_NZD + (EURCAD[in_EURCAD].Close-db_EURCAD)*G_CAD + (EURCHF[in_EURCHF].Close-db_EURCHF)*G_CHF ) * mp_NJp + ( (EURJPY[in_EURJPY].Close-db_EURJPY)*G_JPY ) * mp_YJp );
GBP[idx] = Y_GB + ( ( (db_EURGBP-EURGBP[in_EURGBP].Close)*G_GBP + (GBPAUD[in_GBPAUD].Close-db_GBPAUD)*G_AUD + (GBPNZD[in_GBPNZD].Close-db_GBPNZD)*G_NZD + (GBPUSD[in_GBPUSD].Close-db_GBPUSD)*G_USD + (GBPCAD[in_GBPCAD].Close-db_GBPCAD)*G_CAD + (GBPCHF[in_GBPCHF].Close-db_GBPCHF)*G_CHF ) * mp_NJp + ( (GBPJPY[in_GBPJPY].Close-db_GBPJPY)*G_JPY ) * mp_YJp );
USD[idx] = Y_US + ( ( (db_EURUSD-EURUSD[in_EURUSD].Close)*G_USD + (db_GBPUSD-GBPUSD[in_GBPUSD].Close)*G_USD + (db_AUDUSD-AUDUSD[in_AUDUSD].Close)*G_USD + (db_NZDUSD-NZDUSD[in_NZDUSD].Close)*G_USD + (USDCAD[in_USDCAD].Close-db_USDCAD)*G_CAD + (USDCHF[in_USDCHF].Close-db_USDCHF)*G_CHF ) * mp_NJp + ( (USDJPY[in_USDJPY].Close-db_USDJPY)*G_JPY ) * mp_YJp );
CHF[idx] = Y_CH + ( ( (db_EURCHF-EURCHF[in_EURCHF].Close)*G_CHF + (db_GBPCHF-GBPCHF[in_GBPCHF].Close)*G_CHF + (db_AUDCHF-AUDCHF[in_AUDCHF].Close)*G_CHF + (db_NZDCHF-NZDCHF[in_NZDCHF].Close)*G_CHF + (db_USDCHF-USDCHF[in_USDCHF].Close)*G_CHF + (db_CADCHF-CADCHF[in_CADCHF].Close)*G_CHF ) * mp_NJp + ( (CHFJPY[in_CHFJPY].Close-db_CHFJPY)*G_JPY ) * mp_YJp );
}
private void HistoryBarsGroupB(int idx) //Update Indicator-History-Value - [Group B]
{
AUD[idx] = Y_AU + ( ( (db_EURAUD-EURAUD[in_EURAUD].Close)*G_AUD + (db_GBPAUD-GBPAUD[in_GBPAUD].Close)*G_AUD + (AUDNZD[in_AUDNZD].Close-db_AUDNZD)*G_NZD + (AUDUSD[in_AUDUSD].Close-db_AUDUSD)*G_USD + (AUDCAD[in_AUDCAD].Close-db_AUDCAD)*G_CAD + (AUDCHF[in_AUDCHF].Close-db_AUDCHF)*G_CHF ) * mp_NJp + ( (AUDJPY[in_AUDJPY].Close-db_AUDJPY)*G_JPY ) * mp_YJp );
NZD[idx] = Y_NZ + ( ( (db_EURNZD-EURNZD[in_EURNZD].Close)*G_NZD + (db_GBPNZD-GBPNZD[in_GBPNZD].Close)*G_NZD + (db_AUDNZD-AUDNZD[in_AUDNZD].Close)*G_NZD + (NZDUSD[in_NZDUSD].Close-db_NZDUSD)*G_USD + (NZDCAD[in_NZDCAD].Close-db_NZDCAD)*G_CAD + (NZDCHF[in_NZDCHF].Close-db_NZDCHF)*G_CHF ) * mp_NJp + ( (NZDJPY[in_NZDJPY].Close-db_NZDJPY)*G_JPY ) * mp_YJp );
CAD[idx] = Y_CA + ( ( (db_EURCAD-EURCAD[in_EURCAD].Close)*G_CAD + (db_GBPCAD-GBPCAD[in_GBPCAD].Close)*G_CAD + (db_AUDCAD-AUDCAD[in_AUDCAD].Close)*G_CAD + (db_NZDCAD-NZDCAD[in_NZDCAD].Close)*G_CAD + (db_USDCAD-USDCAD[in_USDCAD].Close)*G_CAD + (CADCHF[in_CADCHF].Close-db_CADCHF)*G_CHF ) * mp_NJp + ( (CADJPY[in_CADJPY].Close-db_CADJPY)*G_JPY ) * mp_YJp );
JPY[idx] = Y_JP + ( ( (db_EURJPY-EURJPY[in_EURJPY].Close)*G_JPY + (db_GBPJPY-GBPJPY[in_GBPJPY].Close)*G_JPY + (db_AUDJPY-AUDJPY[in_AUDJPY].Close)*G_JPY + (db_NZDJPY-NZDJPY[in_NZDJPY].Close)*G_JPY + (db_USDJPY-USDJPY[in_USDJPY].Close)*G_JPY + (db_CADJPY-CADJPY[in_CADJPY].Close)*G_JPY + (db_CHFJPY-CHFJPY[in_CHFJPY].Close)*G_JPY ) * mp_YJp );
}
private void LastBarsGroupA(int idx) //Update Indicator-LastBar-Value - [Group A]
{
EUR[idx] = Y_EU + ( ( (EURUSD.LastBar.Close-db_EURUSD)*G_USD + (EURGBP.LastBar.Close-db_EURGBP)*G_GBP + (EURAUD.LastBar.Close-db_EURAUD)*G_AUD + (EURNZD.LastBar.Close-db_EURNZD)*G_NZD + (EURCAD.LastBar.Close-db_EURCAD)*G_CAD + (EURCHF.LastBar.Close-db_EURCHF)*G_CHF ) * mp_NJp + ( (EURJPY.LastBar.Close-db_EURJPY)*G_JPY ) * mp_YJp );
GBP[idx] = Y_GB + ( ( (db_EURGBP-EURGBP.LastBar.Close)*G_GBP + (GBPAUD.LastBar.Close-db_GBPAUD)*G_AUD + (GBPNZD.LastBar.Close-db_GBPNZD)*G_NZD + (GBPUSD.LastBar.Close-db_GBPUSD)*G_USD + (GBPCAD.LastBar.Close-db_GBPCAD)*G_CAD + (GBPCHF.LastBar.Close-db_GBPCHF)*G_CHF ) * mp_NJp + ( (GBPJPY.LastBar.Close-db_GBPJPY)*G_JPY ) * mp_YJp );
USD[idx] = Y_US + ( ( (db_EURUSD-EURUSD.LastBar.Close)*G_USD + (db_GBPUSD-GBPUSD.LastBar.Close)*G_USD + (db_AUDUSD-AUDUSD.LastBar.Close)*G_USD + (db_NZDUSD-NZDUSD.LastBar.Close)*G_USD + (USDCAD.LastBar.Close-db_USDCAD)*G_CAD + (USDCHF.LastBar.Close-db_USDCHF)*G_CHF ) * mp_NJp + ( (USDJPY.LastBar.Close-db_USDJPY)*G_JPY ) * mp_YJp );
CHF[idx] = Y_CH + ( ( (db_EURCHF-EURCHF.LastBar.Close)*G_CHF + (db_GBPCHF-GBPCHF.LastBar.Close)*G_CHF + (db_AUDCHF-AUDCHF.LastBar.Close)*G_CHF + (db_NZDCHF-NZDCHF.LastBar.Close)*G_CHF + (db_USDCHF-USDCHF.LastBar.Close)*G_CHF + (db_CADCHF-CADCHF.LastBar.Close)*G_CHF ) * mp_NJp + ( (CHFJPY.LastBar.Close-db_CHFJPY)*G_JPY ) * mp_YJp );
}
private void LastBarsGroupB(int idx) //Update Indicator-LastBar-Value - [Group B]
{
AUD[idx] = Y_AU + ( ( (db_EURAUD-EURAUD.LastBar.Close)*G_AUD + (db_GBPAUD-GBPAUD.LastBar.Close)*G_AUD + (AUDNZD.LastBar.Close-db_AUDNZD)*G_NZD + (AUDUSD.LastBar.Close-db_AUDUSD)*G_USD + (AUDCAD.LastBar.Close-db_AUDCAD)*G_CAD + (AUDCHF.LastBar.Close-db_AUDCHF)*G_CHF ) * mp_NJp + ( (AUDJPY.LastBar.Close-db_AUDJPY)*G_JPY ) * mp_YJp );
NZD[idx] = Y_NZ + ( ( (db_EURNZD-EURNZD.LastBar.Close)*G_NZD + (db_GBPNZD-GBPNZD.LastBar.Close)*G_NZD + (db_AUDNZD-AUDNZD.LastBar.Close)*G_NZD + (NZDUSD.LastBar.Close-db_NZDUSD)*G_USD + (NZDCAD.LastBar.Close-db_NZDCAD)*G_CAD + (NZDCHF.LastBar.Close-db_NZDCHF)*G_CHF ) * mp_NJp + ( (NZDJPY.LastBar.Close-db_NZDJPY)*G_JPY ) * mp_YJp );
CAD[idx] = Y_CA + ( ( (db_EURCAD-EURCAD.LastBar.Close)*G_CAD + (db_GBPCAD-GBPCAD.LastBar.Close)*G_CAD + (db_AUDCAD-AUDCAD.LastBar.Close)*G_CAD + (db_NZDCAD-NZDCAD.LastBar.Close)*G_CAD + (db_USDCAD-USDCAD.LastBar.Close)*G_CAD + (CADCHF.LastBar.Close-db_CADCHF)*G_CHF ) * mp_NJp + ( (CADJPY.LastBar.Close-db_CADJPY)*G_JPY ) * mp_YJp );
JPY[idx] = Y_JP + ( ( (db_EURJPY-EURJPY.LastBar.Close)*G_JPY + (db_GBPJPY-GBPJPY.LastBar.Close)*G_JPY + (db_AUDJPY-AUDJPY.LastBar.Close)*G_JPY + (db_NZDJPY-NZDJPY.LastBar.Close)*G_JPY + (db_USDJPY-USDJPY.LastBar.Close)*G_JPY + (db_CADJPY-CADJPY.LastBar.Close)*G_JPY + (db_CHFJPY-CHFJPY.LastBar.Close)*G_JPY ) * mp_YJp );
}
// = = = = = = = = = = = = = = = = = = = = = = = = = Basic Version = = = = = = = = = = = = = = = = = = = = = = = = = //
#endregion
#region Pro Version (Parameters, Definition and Functions)
// * * * * * * * * * * * * * * * * * * * * * * * * * Pro Version * * * * * * * * * * * * * * * * * * * * * * * * * * //
[Parameter("AutoScroll Days", DefaultValue = 0, MinValue = -999, MaxValue = 999, Step =1, Group = "Ver. 2.20" )] public int AtScDay { get; set; }//v.Pro
[Parameter("AutoScroll Hours", DefaultValue = 0, MinValue = -23, MaxValue = 23, Step =1, Group = "Ver. 2.20" )] public int AtScHrs { get; set; }//v.Pro
[Parameter("AutoScroll Minutes", DefaultValue = 0, MinValue = -59, MaxValue = 59, Step =1, Group = "Ver. 2.20" )] public int AtScMin { get; set; }//v.Pro
[Parameter("Cal.Events File Path:",DefaultValue = @"C:\Events.txt", Group = "Calendar Events")] public string KyEvtPath { get; set; }//v.Pro
[Parameter("Input Time ±GMT:", DefaultValue = "+01:00", Group = "Calendar Events")] public string InputTime { get; set; }//v.Pro
[Parameter("User Time ±GMT:", DefaultValue = "+02:00", Group = "Calendar Events")] public string OtPutTime { get; set; }//v.Pro
[Parameter("Viewable Range +", DefaultValue = 450, Step = 50, MinValue = 0, Group = "Y-axis Scale" )] public double PVRange { get; set; } //v.Pro
[Parameter("Viewable Range -", DefaultValue = -450, Step = 50, MaxValue = 0, Group = "Y-axis Scale" )] public double MVRange { get; set; } //v.Pro
[Parameter("Y-Gridline Gap", DefaultValue = 200, Step = 50, MinValue =-50, Group = "Y-axis Scale" )] public int YxisGap { get; set; } //v.Pro
[Parameter("Total Spread", DefaultValue = "True", Group = "Indicator Label")] public bool SprdSm { get; set; } //v.Pro
[Parameter("Currency Name", DefaultValue = "True", Group = "Indicator Label")] public bool NmMrkr { get; set; } //v.Pro
[Parameter("Indicator Y-Value", DefaultValue = "True", Group = "Indicator Label")] public bool DiMrkr { get; set; } //v.Pro
// = = = = = = = = = = = = = = = = = = = = = = = = = Pro Version = = = = = = = = = = = = = = = = = = = = = = = = = = //
// * * * * * * * * * * * * * * * * * * * * * * * * * Pro Version * * * * * * * * * * * * * * * * * * * * * * * * * * //
private bool b_YRange = true; //Switch: AutoSet ViewableY-Range;(Default: On)
private bool wf_EUR=true, wf_GBP=true, wf_AUD=true, wf_NZD=true; //Switch: Label FrontPartText; (Default: On)
private bool wf_USD=true, wf_CAD=true, wf_CHF=true, wf_JPY=true; // ...
private bool b_TimeGroup, b_TickGroup; //Status: TimeFrame is in TimeGroup, TickGroup;
private int i_LblMkrLth; //Length of Label Marker(<);
private string s_TFNm; //Chart TimeFrameName;
//Spread of EachSymbol : Defined at Calculate()
private double sp_EURUSD, sp_EURGBP, sp_EURAUD, sp_EURNZD, sp_EURCAD, sp_EURCHF, sp_EURJPY;
private double sp_GBPUSD, sp_GBPAUD, sp_GBPNZD, sp_GBPCAD, sp_GBPCHF, sp_GBPJPY;
private double sp_AUDUSD, sp_AUDNZD, sp_AUDCAD, sp_AUDCHF, sp_AUDJPY;
private double sp_NZDUSD, sp_NZDCAD, sp_NZDCHF, sp_NZDJPY;
private double sp_USDCAD, sp_CADCHF, sp_CADJPY;
private double sp_USDCHF, sp_CHFJPY;
private double sp_USDJPY;
private double S_EUR, S_GBP, S_USD, S_AUD, S_NZD, S_CAD, S_CHF, S_JPY; //TotalSpread of EachCurrency
private string m_US, m_EU, m_GB, m_AU, m_NZ, m_CA, m_CH, m_JP; //LabelText of CurrencyNames
private string s_US, s_EU, s_GB, s_AU, s_NZ, s_CA, s_CH, s_JP; //LabelText of Total Spreads
private string d_US, d_EU, d_GB, d_AU, d_NZ, d_CA, d_CH, d_JP; //LabelText of Indicator-Value
private DateTime dt_AtoScr; //Auto-Scroll TimePoint;
private Color cl_LdnMsg=Color.FromHex("#AAEEDDCC"); //Color of loading message(Changeable);
private Color cf_EUR, cf_GBP, cf_AUD, cf_NZD, cf_USD, cf_CAD, cf_CHF, cf_JPY; //Gradient color for Indicator ForeLabelText (Spred, Bias, Value, ZipValue etc.);
private ChartText t_US, t_EU, t_GB, t_AU, t_NZ, t_CA, t_CH, t_JP; //LabelText for EachCurrency
private static readonly Color cl_GrdLn0=Color.FromHex("#30FFFFFF"), cl_GrdLnO=Color.FromHex("#30999999"), cl_DftMsg=Color.FromHex("#AAEEDDCC"); //Color: Y-GridLine 0, OtherLines, Loading message for restoring;;
private readonly static string n_US="USD", n_EU="EUR", n_GB="GBP", n_CH="CHF", n_AU="AUD", n_NZ="NZD", n_CA="CAD", n_JP="JPY"; //Currency (Indicator) Name
private readonly static string c_US="US", c_EU="EU", c_GB="UK", c_CH="CH", c_AU="AU", c_NZ="NZ", c_CA="CA", c_JP="JP", c_CN="CN"; //CountryCodes: EachCurrency;
private readonly static string c_GrpA = "US UK CH EU DE FR IT SP CN", c_GrpB = "AU NZ CA JP CN", c_EA = "EU DE FR IT SP"; //CountryCodes: GroupA,B,EuropeanArea;
private readonly static string nSp = " ", nCl = ": ", nDs = " - ", nMi = "-", nPo = "+", Ent="\n", Emp = string.Empty; //Letter & Symbos: ' ', ':', ' - ', '-', '+', NewLine, EndofString;
private readonly static string fmt_Sprd = "0.0 ", fmt_Idct = " +0.0; -0.0;", fmt_Grd = "GL +0.0;-0.0;" ; //Format: TotalSpread, IndicatorValue, Y-RangeGridLine's;
private readonly static string fmt_ZmV = "MM-dd HH:mm", fmt_Evt = "HH:mm", pfx_fil = "■", pfx_emp = "□" ; //Format: X-GridLine, Event UserTime formats; ProgressBar: Filled-Block, Empty-Block;
private readonly static string pfx_ZmV = "5MinGrid ", pfx_EvnMkr = "EvntMkr-", pfx_EvnTxt = "EvntTxt-" ; //Prefix: X-GridLine, Envent's Marker and Text;
private readonly static string pfx_Lb = "LB_", pfx_Ut = "UT_", pfx_Lt = "LT_" ; //Prefix: of LabelFrontPartTextName, UpperTrendLineName, LowerTrendLineName
private readonly static string act_zmm = "Zoom %: ", act_ScD = "Chart Scrolling is disabled... " ; //Action: ZoomTo, ScrollingDisabled
private readonly static string act_Rdy = "Ctrl+Click: Reset Y-Range; Shift+Click: Scroll to Reset-Time-Point ..."; //Action: MessageOfReady
private readonly static string fnt_DjSM = "DejaVu Sans Mono"; //FontName: "DejaVu Sans Mono";
//Loading Messages (TextBox for loading, debugging etc.;)
private readonly TextBox tx_Load=new () { BorderThickness=0, Margin="0 0 0 15", Text="", FontSize=12.5, FontFamily=fnt_DjSM, FontWeight=FontWeight.Regular, IsReadOnly=true, IsReadOnlyCaretVisible=false,
VerticalAlignment=VerticalAlignment.Bottom, HorizontalAlignment=HorizontalAlignment.Center, ForegroundColor=cl_DftMsg, BackgroundColor=Color.Transparent, BorderColor=Color.Transparent };
// = = = = = = = = = = = = = = = = = = = = = = = = = Pro Version = = = = = = = = = = = = = = = = = = = = = = = = = = //
// * * * * * * * * * * * * * * * * * * * * * * * * * Pro Version * * * * * * * * * * * * * * * * * * * * * * * * * * //
private void ChartYGrid() //Draw Horizental Line: Chart Y-Grid
{
if (YxisGap <= 0) { return; } //Hide GridLines
for (int i = 0; i <= 10000; i += YxisGap)
{
Chart.DrawHorizontalLine( ( i).ToString(fmt_Grd), i, cl_GrdLnO, 1, LineStyle.Dots );
Chart.DrawHorizontalLine( (-i).ToString(fmt_Grd), -i, i==0?cl_GrdLn0:cl_GrdLnO, 1, i==0?LineStyle.Solid:LineStyle.Dots );
}
}
private void ChartXGrid() //Draw VerticalGridLines (5-Minute Marker)
{
//Plot 5Minutes Gridline only in TimeFrame-1Minute and SmallerTick100(ProjectVersion)
if ( (b_TimeGroup && Chart.TimeFrame!=TimeFrame.Minute) || (b_TickGroup && Chart.TimeFrame>TimeFrame.Tick100) ) return;
DateTime dt_Start = BarsD1.LastBar.OpenTime.AddDays(-1); //Get StarTime for VerticalGridline
DateTime dt_End = BarsD1.LastBar.OpenTime.AddDays( 1); //Get End-Time for VerticalGridLine
//Plot VerticalLines according TimeFrame
if (Chart.ZoomLevel == 15 || Chart.ZoomLevel == 30) //Zoom15% or 30% - Draw 5Min VerticalLines to the end of the day
{
for (DateTime currentTime = dt_Start; currentTime <= dt_End; currentTime = currentTime.AddMinutes(5))
{
LineStyle lineStyle = currentTime == currentTime.Date.AddHours(currentTime.Hour) ? LineStyle.Solid : LineStyle.DotsRare; //SolidLine for currentTime is hour of the clock
Chart.DrawVerticalLine(pfx_ZmV + currentTime.ToString(fmt_ZmV), currentTime, cl_GrdLnO, 1, lineStyle); //Plot
}
}
else if (Chart.ZoomLevel == 5 ) //Zoom5% - Remove 5Min VerticalLines
{
var vLines = Chart.FindAllObjects(ChartObjectType.VerticalLine).Where(x => x.Name.Contains(pfx_ZmV));
foreach (ChartVerticalLine vline in vLines.Cast<ChartVerticalLine>()) { Chart.RemoveObject(vline.Name); }
}
}
private void DrawAllEvents() //Draw All KeyEvents Labels in Chart (According to Group A,B; Must after b_YRange Defined)
{
bool b_UorD = true; //Event's Up(true) and Down(false)
if (!File.Exists(KyEvtPath)) { return; } //Check FileExist(NetWork Connection)
//Remove PreviousDrawings, avert DuiplicatDrawing or OneLine draw to BothUpandDown: TrendLine, Text
var Txs = Chart.FindAllObjects(ChartObjectType.Text ).Where(x => x.Name.Contains(pfx_EvnTxt));
foreach (ChartObject Tx in Txs) { Chart.RemoveObject(Tx.Name); }
var Trs = Chart.FindAllObjects(ChartObjectType.TrendLine).Where(x => x.Name.Contains(pfx_EvnMkr));
foreach (ChartObject Tr in Trs) { Chart.RemoveObject(Tr.Name); }
foreach (string line in File.ReadLines(KyEvtPath)) //Load EachLine of txt file
{
string[] events = line.Split((char)44); //Split by ','
bool GroupEvent = (GroupA && c_GrpA.Contains(events[2])) || (GroupB && c_GrpB.Contains(events[2])); //Check Country Code
DrawOneEvnt(events[0], events[1], events[2], events[3], events[4], b_UorD); b_UorD = !b_UorD; //Reverse Event's Side
}
}
private void DrawOneEvnt(string dt_Date, string tm_Time, string ct_Cnty, string et_Evnt, string et_Ent2, bool b_UorD) //Draw One KeyEvent's Label in Chart
{
//Get Event's ServerTime
DateTime EvntSrvTime = DateTime.Parse(dt_Date + nSp + tm_Time);
if (InputTime.Contains(nMi)) { EvntSrvTime = EvntSrvTime.Add(+(TimeSpan.Parse(InputTime.Replace(nMi,nSp)))); }
else { EvntSrvTime = EvntSrvTime.Add(-(TimeSpan.Parse(InputTime.Replace(nPo,nSp)))); }
//Get Event's UserTime
if (OtPutTime.Contains(nMi)) { tm_Time = EvntSrvTime.Add(-(TimeSpan.Parse(OtPutTime.Replace(nMi,nSp)))).ToString(fmt_Evt); }
else { tm_Time = EvntSrvTime.Add(+(TimeSpan.Parse(OtPutTime.Replace(nPo,nSp)))).ToString(fmt_Evt); }
string tx_Ctnt = tm_Time + nSp + ct_Cnty + Ent + et_Evnt + Ent + et_Ent2; //Event's Content with user's time: "13:30 US\nPersonal\nSpending"
string tx_Name = dt_Date + nSp + tm_Time + nCl + ct_Cnty + nDs + et_Evnt; //Event's ID: Date,Time,CountryCode,EventName,UporDown (Enable SameEventBothUpandDown)
tx_Name += b_UorD ? pfx_fil : pfx_emp; //Event's ID: For refreshing SameEventBothUpandDown (■:upper □:lower)
//Default Upper,Lower value for TrendLineEnd and Text;
double db_YVal = 0; //Actual Y-value to draw;
if (b_YRange) { db_YVal = b_UorD ? PVRange*0.9 : MVRange*0.9 ; } //Y-ViewableRange is On, position close to the edge of Y-Ends;
else { db_YVal = b_UorD ? 400 : -400 ; } //Y-ViewableRange is Off, position set to ±400;
//Define Event's Text VerticalAlignment
VerticalAlignment EvntTxtVA = b_UorD ? VerticalAlignment.Bottom : VerticalAlignment.Top;
//Define Keyvents Marker and Text Color according to CountryCode
Color cl_Mkr = Color.Transparent, cl_Txt = Color.Transparent;
if (c_EA.Contains(ct_Cnty)) { cl_Mkr = Color.FromArgb(80, cl_EUR); cl_Txt = Color.FromArgb(120, cl_EUR); }
else if (ct_Cnty == c_US) { cl_Mkr = Color.FromArgb(80, cl_USD); cl_Txt = Color.FromArgb(120, cl_USD); }
else if (ct_Cnty == c_GB) { cl_Mkr = Color.FromArgb(80, cl_GBP); cl_Txt = Color.FromArgb(120, cl_GBP); }
else if (ct_Cnty == c_CH) { cl_Mkr = Color.FromArgb(80, cl_CHF); cl_Txt = Color.FromArgb(120, cl_CHF); }
else if (ct_Cnty == c_AU) { cl_Mkr = Color.FromArgb(80, cl_AUD); cl_Txt = Color.FromArgb(120, cl_AUD); }
else if (ct_Cnty == c_NZ) { cl_Mkr = Color.FromArgb(80, cl_NZD); cl_Txt = Color.FromArgb(120, cl_NZD); }
else if (ct_Cnty == c_CA) { cl_Mkr = Color.FromArgb(80, cl_CAD); cl_Txt = Color.FromArgb(120, cl_CAD); }
else if (ct_Cnty == c_JP) { cl_Mkr = Color.FromArgb(80, cl_JPY); cl_Txt = Color.FromArgb(120, cl_JPY); }
else if (ct_Cnty == c_CN) { cl_Mkr = Color.FromArgb(80, cl_USD); cl_Txt = Color.FromArgb(120, cl_USD); }
else if (ct_Cnty == c_EU) { cl_Mkr = Color.FromArgb(80, cl_EUR); cl_Txt = Color.FromArgb(120, cl_EUR); }
//Draw TimeLine Marker
Chart.DrawTrendLine(pfx_EvnMkr + tx_Name, EvntSrvTime, 0, EvntSrvTime, db_YVal, cl_Mkr, 1, LineStyle.Solid);
//Draw TextBox Content, set VerticalAlignment anchor according CountryCode
ChartText tx_Events = Chart.DrawText(pfx_EvnTxt + tx_Name, tx_Ctnt, EvntSrvTime, db_YVal, cl_Txt); tx_Events.VerticalAlignment = EvntTxtVA;
}
private void DefineLabelMarkerLength() //Defeine Length of LabelMarker according ZoomLevel
{
int zm = Chart.ZoomLevel;
i_LblMkrLth = zm == 5 ? 8 : zm == 15 ? 3 : zm >= 30 ? 2 : 3; //Define LabelMarkerLength: Zoom5% 8 bars, 15% 3 bars, 30% 2 bars, others 3 bars;
}
private void LabelColor() //Define the colorTransparent for all IndicatorsLabels [Pro Version]
{
int g_US=225, g_EU=225, g_GB=225, g_CH=225, g_AU=225, g_NZ=225, g_CA=225, g_JP=225; //(Decimal Max255 Argb.A)
//LabelForePartColor
cf_USD= Color.FromArgb(g_US, cl_USD);
cf_EUR= Color.FromArgb(g_EU, cl_EUR);
cf_GBP= Color.FromArgb(g_GB, cl_GBP);
cf_CHF= Color.FromArgb(g_CH, cl_CHF);
cf_AUD= Color.FromArgb(g_AU, cl_AUD);
cf_NZD= Color.FromArgb(g_NZ, cl_NZD);
cf_CAD= Color.FromArgb(g_CA, cl_CAD);
cf_JPY= Color.FromArgb(g_JP, cl_JPY);
}
private void UpdateSymbolsSpreads() //Get Spreads for EachSymbol, Defined: Calculate(IsLastBar)
{
sp_EURUSD = mp_NJp * Symbols.GetSymbol(s_EURUSD).Spread; sp_GBPUSD = mp_NJp * Symbols.GetSymbol(s_GBPUSD).Spread; sp_AUDUSD = mp_NJp * Symbols.GetSymbol(s_AUDUSD).Spread; sp_NZDUSD = mp_NJp * Symbols.GetSymbol(s_NZDUSD).Spread;
sp_EURGBP = mp_NJp * Symbols.GetSymbol(s_EURGBP).Spread; sp_GBPAUD = mp_NJp * Symbols.GetSymbol(s_GBPAUD).Spread; sp_AUDCAD = mp_NJp * Symbols.GetSymbol(s_AUDCAD).Spread; sp_NZDCAD = mp_NJp * Symbols.GetSymbol(s_NZDCAD).Spread;
sp_EURAUD = mp_NJp * Symbols.GetSymbol(s_EURAUD).Spread; sp_GBPCAD = mp_NJp * Symbols.GetSymbol(s_GBPCAD).Spread; sp_AUDNZD = mp_NJp * Symbols.GetSymbol(s_AUDNZD).Spread; sp_NZDCHF = mp_NJp * Symbols.GetSymbol(s_NZDCHF).Spread;
sp_EURCAD = mp_NJp * Symbols.GetSymbol(s_EURCAD).Spread; sp_GBPNZD = mp_NJp * Symbols.GetSymbol(s_GBPNZD).Spread; sp_AUDCHF = mp_NJp * Symbols.GetSymbol(s_AUDCHF).Spread; sp_NZDJPY = mp_YJp * Symbols.GetSymbol(s_NZDJPY).Spread;
sp_EURNZD = mp_NJp * Symbols.GetSymbol(s_EURNZD).Spread; sp_GBPCHF = mp_NJp * Symbols.GetSymbol(s_GBPCHF).Spread; sp_AUDJPY = mp_YJp * Symbols.GetSymbol(s_AUDJPY).Spread;
sp_EURCHF = mp_NJp * Symbols.GetSymbol(s_EURCHF).Spread; sp_GBPJPY = mp_YJp * Symbols.GetSymbol(s_GBPJPY).Spread; sp_USDCAD = mp_NJp * Symbols.GetSymbol(s_USDCAD).Spread;
sp_EURJPY = mp_YJp * Symbols.GetSymbol(s_EURJPY).Spread; sp_USDCHF = mp_NJp * Symbols.GetSymbol(s_USDCHF).Spread; sp_CADCHF = mp_NJp * Symbols.GetSymbol(s_CADCHF).Spread;
sp_USDJPY = mp_YJp * Symbols.GetSymbol(s_USDJPY).Spread; sp_CHFJPY = mp_YJp * Symbols.GetSymbol(s_CHFJPY).Spread; sp_CADJPY = mp_YJp * Symbols.GetSymbol(s_CADJPY).Spread;
}
private void SpreadTextGroupA() //Get TotalSpreads for EachCurrency and convert to string - [Group A]
{
S_USD = sp_EURUSD + sp_GBPUSD + sp_AUDUSD + sp_USDCAD + sp_NZDUSD + sp_USDCHF + sp_USDJPY; s_US = S_USD.ToString(fmt_Sprd);
S_EUR = sp_EURUSD + sp_EURGBP + sp_EURAUD + sp_EURCAD + sp_EURNZD + sp_EURCHF + sp_EURJPY; s_EU = S_EUR.ToString(fmt_Sprd);
S_GBP = sp_EURGBP + sp_GBPUSD + sp_GBPAUD + sp_GBPCAD + sp_GBPNZD + sp_GBPCHF + sp_GBPJPY; s_GB = S_GBP.ToString(fmt_Sprd);
S_CHF = sp_EURCHF + sp_GBPCHF + sp_AUDCHF + sp_USDCHF + sp_NZDCHF + sp_CADCHF + sp_CHFJPY; s_CH = S_CHF.ToString(fmt_Sprd);
}
private void SpreadTextGroupB() //Get TotalSpreads for EachCurrency and convert to string - [Group B]
{
S_AUD = sp_EURAUD + sp_GBPAUD + sp_AUDNZD + sp_AUDUSD + sp_AUDCAD + sp_AUDCHF + sp_AUDJPY; s_AU = S_AUD.ToString(fmt_Sprd);
S_NZD = sp_EURNZD + sp_GBPNZD + sp_AUDNZD + sp_NZDUSD + sp_NZDCAD + sp_NZDCHF + sp_NZDJPY; s_NZ = S_NZD.ToString(fmt_Sprd);
S_CAD = sp_EURCAD + sp_GBPCAD + sp_AUDCAD + sp_NZDCAD + sp_USDCAD + sp_CADCHF + sp_CADJPY; s_CA = S_CAD.ToString(fmt_Sprd);
S_JPY = sp_EURJPY + sp_GBPJPY + sp_AUDJPY + sp_USDJPY + sp_NZDJPY + sp_CADJPY + sp_CHFJPY; s_JP = S_JPY.ToString(fmt_Sprd);
}
private void ValueTextGroupA(int idx) //Get IndicatorValue for EachCurrency and convert to string - [Group A]
{
d_US = USD[idx].ToString(fmt_Idct);
d_EU = EUR[idx].ToString(fmt_Idct);
d_GB = GBP[idx].ToString(fmt_Idct);
d_CH = CHF[idx].ToString(fmt_Idct);
}
private void ValueTextGroupB(int idx) //Get IndicatorValue for EachCurrency and convert to string - [Group B]
{
d_AU = AUD[idx].ToString(fmt_Idct);
d_NZ = NZD[idx].ToString(fmt_Idct);
d_CA = CAD[idx].ToString(fmt_Idct);
d_JP = JPY[idx].ToString(fmt_Idct);
}
private void DrawLabelForePartGroupA(int idx, int idxx) //Draw Label's Marker and ForePartText (TotalSpread, CurrencyName, IndicatorValue with indivicual switch) - [Group A]
{
if (wf_USD)
{
Chart.DrawTrendLine(pfx_Ut+n_US, idx, USD.LastValue, idxx, USD.LastValue+S_USD/2, cf_USD); //USD's UpperLine
Chart.DrawTrendLine(pfx_Lt+n_US, idx, USD.LastValue, idxx, USD.LastValue-S_USD/2, cf_USD); //USD's LowerLine
t_US = Chart.DrawText(pfx_Lb+n_US, s_US+m_US+d_US, idxx, USD.LastValue, cf_USD); //USD's FrontPartText (Pro Ver.)
t_US.VerticalAlignment = VerticalAlignment.Center;
}
if (wf_EUR)
{
Chart.DrawTrendLine(pfx_Ut+n_EU, idx, EUR.LastValue, idxx, EUR.LastValue+S_EUR/2, cf_EUR); //EUR's UpperLine
Chart.DrawTrendLine(pfx_Lt+n_EU, idx, EUR.LastValue, idxx, EUR.LastValue-S_EUR/2, cf_EUR); //EUR's LowerLine
t_EU = Chart.DrawText(pfx_Lb+n_EU, s_EU+m_EU+d_EU, idxx, EUR.LastValue, cf_EUR); //EUR's FrontPartText (Pro Ver.)
t_EU.VerticalAlignment = VerticalAlignment.Center;
}
if (wf_GBP)
{
Chart.DrawTrendLine(pfx_Ut+n_GB, idx, GBP.LastValue, idxx, GBP.LastValue+S_GBP/2, cf_GBP); //GBP's UpperLine
Chart.DrawTrendLine(pfx_Lt+n_GB, idx, GBP.LastValue, idxx, GBP.LastValue-S_GBP/2, cf_GBP); //GBP's LowerLine
t_GB = Chart.DrawText(pfx_Lb+n_GB, s_GB+m_GB+d_GB, idxx, GBP.LastValue, cf_GBP); //GBP's FrontPartText (Pro Ver.)
t_GB.VerticalAlignment = VerticalAlignment.Center;
}
if (wf_CHF)
{
Chart.DrawTrendLine(pfx_Ut+n_CH, idx, CHF.LastValue, idxx, CHF.LastValue+S_CHF/2, cf_CHF); //CHF's UpperLine
Chart.DrawTrendLine(pfx_Lt+n_CH, idx, CHF.LastValue, idxx, CHF.LastValue-S_CHF/2, cf_CHF); //CHF's LowerLine
t_CH = Chart.DrawText(pfx_Lb+n_CH, s_CH+m_CH+d_CH, idxx, CHF.LastValue, cf_CHF); //CHF's FrontPartText (Pro Ver.)
t_CH.VerticalAlignment = VerticalAlignment.Center;
}
}
private void DrawLabelForePartGroupB(int idx, int idxx) //Draw Label's Marker and ForePartText (TotalSpread, CurrencyName, IndicatorValue with indivicual switch) - [Group B]
{
if (wf_AUD)
{
Chart.DrawTrendLine(pfx_Ut+n_AU, idx, AUD.LastValue, idxx, AUD.LastValue+S_AUD/2, cf_AUD); //AUD's UpperLine
Chart.DrawTrendLine(pfx_Lt+n_AU, idx, AUD.LastValue, idxx, AUD.LastValue-S_AUD/2, cf_AUD); //AUD's LowerLine
t_AU = Chart.DrawText(pfx_Lb+n_AU, s_AU+m_AU+d_AU, idxx, AUD.LastValue, cf_AUD); //AUD's FrontPartText (Pro Ver.)
t_AU.VerticalAlignment = VerticalAlignment.Center;
}
if (wf_NZD)
{
Chart.DrawTrendLine(pfx_Ut+n_NZ, idx, NZD.LastValue, idxx, NZD.LastValue+S_NZD/2, cf_NZD); //NZD's UpperLine
Chart.DrawTrendLine(pfx_Lt+n_NZ, idx, NZD.LastValue, idxx, NZD.LastValue-S_NZD/2, cf_NZD); //NZD's LowerLine
t_NZ = Chart.DrawText(pfx_Lb+n_NZ, s_NZ+m_NZ+d_NZ, idxx, NZD.LastValue, cf_NZD); //NZD's FrontPartText (Pro Ver.)
t_NZ.VerticalAlignment = VerticalAlignment.Center;
}
if (wf_CAD)
{
Chart.DrawTrendLine(pfx_Ut+n_CA, idx, CAD.LastValue, idxx, CAD.LastValue+S_CAD/2, cf_CAD); //CAD's UpperLine
Chart.DrawTrendLine(pfx_Lt+n_CA, idx, CAD.LastValue, idxx, CAD.LastValue-S_CAD/2, cf_CAD); //CAD's LowerLine
t_CA = Chart.DrawText(pfx_Lb+n_CA, s_CA+m_CA+d_CA, idxx, CAD.LastValue, cf_CAD); //CAD's FrontPartText (Pro Ver.)
t_CA.VerticalAlignment = VerticalAlignment.Center;
}
if (wf_JPY)
{
Chart.DrawTrendLine(pfx_Ut+n_JP, idx, JPY.LastValue, idxx, JPY.LastValue+S_JPY/2, cf_JPY); //JPY's UpperLine
Chart.DrawTrendLine(pfx_Lt+n_JP, idx, JPY.LastValue, idxx, JPY.LastValue-S_JPY/2, cf_JPY); //JPY's LowerLine
t_JP = Chart.DrawText(pfx_Lb+n_JP, s_JP+m_JP+d_JP, idxx, JPY.LastValue, cf_JPY); //JPY's FrontPartText (Pro Ver.)
t_JP.VerticalAlignment = VerticalAlignment.Center;
}
}
// = = = = = = = = = = = = = = = = = = = = = = = = = Pro Version = = = = = = = = = = = = = = = = = = = = = = = = = = //
#endregion
}
}
Capt.Z-Fort.Builder
Joined on 03.06.2020
- Distribution: Free
- Language: C#
- Trading platform: cTrader Automate
- File name: Currency Strength Meter v2.20 SoueceCode.algo
- Rating: 4.29
- Installs: 376
- Modified: 08/06/2024 00:59

Comments
@jestebansuarez
There are many possible reasons to block the proper display of the indicator. It depends on the parameters you set up. You can join https://t.me/cTraderFXClub group to talk about more details.
Thanks.
I love this indicator, thanks for your efforts, but i won't reload the second time I open cTrader, load the first time to set it, never again, any idea/solution?
Rgds,
Hello Capt,
I have a question: when initiating the indicator with different reset dates, i'm getting different results for the same dates. For example:
Reset dates of: 01/06/2023 and 01/07/2023
The results of July's month are diff between the indicator. I'll be happy to understand this.
BR
v2.12 Add function: User can set the timespan gap between AutoScroll-TimePoint and Reset DateTime;
This is a minor update.
v2.09 Optimise : Fixed a color code bug when running in cTrader ver 4.5.1;
- v2.08 Add function : User can define KeyEvent's TimeFormat (±GMT); Framework .NET 6.0 ready;
- v2.04 Optimise : Code Structure(tiny changes);
- v2.03 Add function: Display 5-Minute VerticalGridlines, when chart zooms to 15% or 30%
in TimeFrame-1Minute, zoom back to 5% will be removed;
Optimise : Code Structure (Move repeat constants to readonly variables),
: Auto-load more history data for indicators to display,
: Display KeyEvents up and down in turn to avoid overlapping;
- v2.02 Optimise: Indicators calculation, Displaying of Label and Code Structure;
- v2.01 Alt+MouseLeftClick in the chart, to turn off/on AutoSet Y-Axis viewable range; Optimise displaying of labels; Fixed bug of total spread;
You can join my Telegram Group for easy discussion there.
Labels are shown at the end of the indicator, it's working normally also, just tick all 'Yes' on the setting page under the Label group.
It's working perfectly here. I only use it in TimeFrame 1minute(intraday) and 4minute(weekly long)
You can set Y-range auto-scaled by put 0/0, to viewable range +-.
- v1.11 Label can show or (set to 0) hide the spread sum of relevant symbols, and also displayed as pointer gap; User can adjust Y-axis Gridline gap value (0 to hide);
- v1.10 Improve calculation and efficiency, (add 'pips-value' factor to the results according to base currency), optimise chart view settings;
- v1.09 Reformat marker's value (+0.0 -0.0), hide pointer when Digitals and Name both off; Y-range can be auto-arranged if set to 0/0; Y-Axis Gridline can be set off;
- v1.08 Auto-scroll to two trading hours before Reset-Time-Point;
v1.07 Rewrite indicator calculation, Y-Axis range, and autohide base bars; (Reloading is more quickly when adjusting viewable range)
Updated to v1.06: Add CurrencyName to indicator cursor, User control whether to show digitals or name;
Version 2.20 Add New Functions: