Description
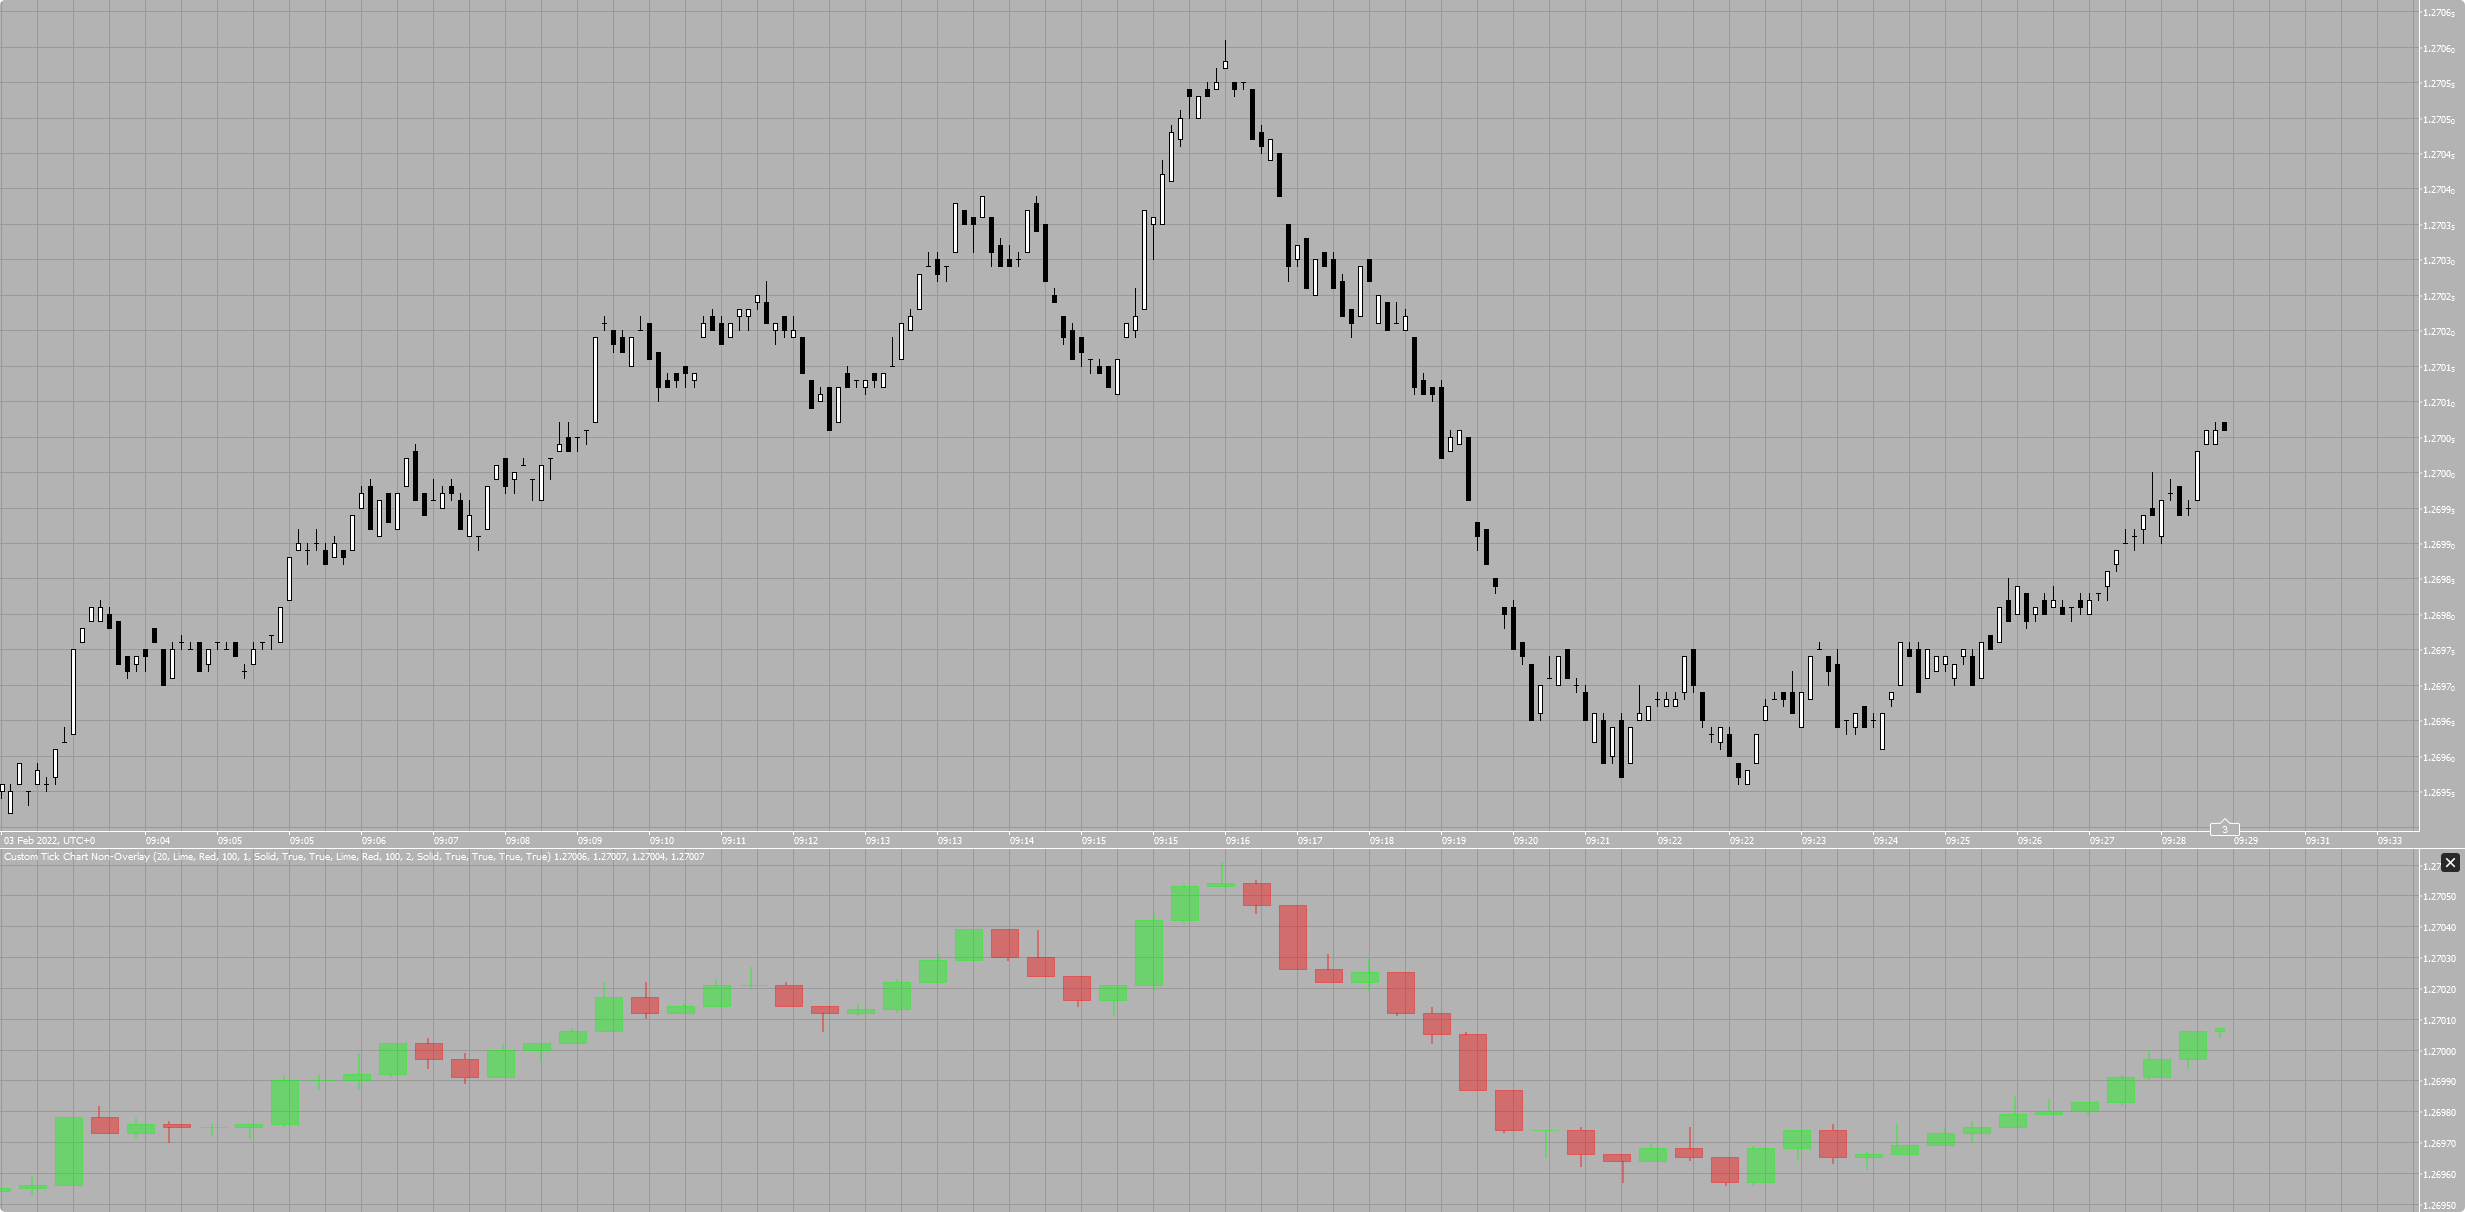
This indicator allows you to create custom Tick charts by using the current available Tick chart on cTrader.
You can set the tick size to any value you want to, you can also attach the cTrader indicators on custom generated chart OHLC outputs.
Features
- Creates custom size tick charts
- Separate on chart and non-overlay versions
- You can change the colors of bars
- Shows the high/low wicks for bars
- You can use the custom chart outputs as a source for other indicators
Changelog
Version 1.2.1.0
Release Date: June 1, 2022
Fixed: Issue with cTrader 4.2
Version 1.2.0.0
Release Date: May 27, 2022
Removed: Error messages
Added: Automatically changes the chart period to an appropriate Tick period that the custom tick chart can be generated from
Added: Making the actual chart bars transparent (only overlay version)
Fixed: Issue with attached indicators
Version 1.1.0.0
Release Date: May 26, 2022
Fixed: Outputs issue
This indicator is open source, if you want to contribute:
using cAlgo.API;
using System;
using System.Globalization;
using System.Linq;
using System.Collections.Generic;

namespace cAlgo
{
    [Indicator(IsOverlay = false, TimeZone = TimeZones.UTC, AccessRights = AccessRights.None)]
    public class CustomTickChart : Indicator
    {
        #region Fields

        private const string Name = "Custom Tick Chart";

        private const string TimeFrameNamePrefix = "Tick";

        private string _chartObjectNamesSuffix;

        private CustomOhlcBar _lastBar, _previousBar;

        private Color _bullishBarBodyColor, _bullishBarWickColor, _bearishBarBodyColor, _bearishBarWickColor;

        private bool _isChartTypeValid;

        private Bars _bars;

        private int _timeFrameSizeRatio, _barNumber, _lastBarIndex = -1;

        private readonly List<CustomOhlcBar> _customBars = new List<CustomOhlcBar>();

        #endregion Fields

        #region Parameters

        [Parameter("Size(Ticks)", DefaultValue = 75, Group = "General")]
        public int SizeInTicks { get; set; }

        [Parameter("Bullish Bar Color", DefaultValue = "Lime", Group = "Body")]
        public string BullishBarBodyColor { get; set; }

        [Parameter("Bearish Bar Color", DefaultValue = "Red", Group = "Body")]
        public string BearishBarBodyColor { get; set; }

        [Parameter("Opacity", DefaultValue = 100, MinValue = 0, MaxValue = 255, Group = "Body")]
        public int BodyOpacity { get; set; }

        [Parameter("Thickness", DefaultValue = 1, Group = "Body")]
        public int BodyThickness { get; set; }

        [Parameter("Line Style", DefaultValue = LineStyle.Solid, Group = "Body")]
        public LineStyle BodyLineStyle { get; set; }

        [Parameter("Fill", DefaultValue = true, Group = "Body")]
        public bool FillBody { get; set; }

        [Parameter("Show", DefaultValue = true, Group = "Wicks")]
        public bool ShowWicks { get; set; }

        [Parameter("Bullish Bar Color", DefaultValue = "Lime", Group = "Wicks")]
        public string BullishBarWickColor { get; set; }

        [Parameter("Bearish Bar Color", DefaultValue = "Red", Group = "Wicks")]
        public string BearishBarWickColor { get; set; }

        [Parameter("Opacity", DefaultValue = 100, MinValue = 0, MaxValue = 255, Group = "Wicks")]
        public int WicksOpacity { get; set; }

        [Parameter("Thickness", DefaultValue = 2, Group = "Wicks")]
        public int WicksThickness { get; set; }

        [Parameter("Line Style", DefaultValue = LineStyle.Solid, Group = "Wicks")]
        public LineStyle WicksLineStyle { get; set; }

        [Parameter("Open", DefaultValue = true, Group = "OHLC Outputs")]
        public bool IsOpenOutputEnabled { get; set; }

        [Parameter("High", DefaultValue = true, Group = "OHLC Outputs")]
        public bool IsHighOutputEnabled { get; set; }

        [Parameter("Low", DefaultValue = true, Group = "OHLC Outputs")]
        public bool IsLowOutputEnabled { get; set; }

        [Parameter("Close", DefaultValue = true, Group = "OHLC Outputs")]
        public bool IsCloseOutputEnabled { get; set; }

        #endregion Parameters

        #region Other properties

        public ChartArea Area
        {
            get { return IndicatorArea ?? (ChartArea)Chart; }
        }

        #endregion Other properties

        #region Outputs

        [Output("Open", LineColor = "Transparent", PlotType = PlotType.Line)]
        public IndicatorDataSeries Open { get; set; }

        [Output("High", LineColor = "Transparent", PlotType = PlotType.Line)]
        public IndicatorDataSeries High { get; set; }

        [Output("Low", LineColor = "Transparent", PlotType = PlotType.Line)]
        public IndicatorDataSeries Low { get; set; }

        [Output("Close", LineColor = "Transparent", PlotType = PlotType.Line)]
        public IndicatorDataSeries Close { get; set; }

        #endregion Outputs

        #region Overridden methods

        protected override void Initialize()
        {
            _chartObjectNamesSuffix = string.Format("{0}_{1}", Name, DateTime.Now.Ticks);

            var timeFrameName = Chart.TimeFrame.ToString();

            timeFrameName = timeFrameName.Equals("tick", StringComparison.OrdinalIgnoreCase) ? "Tick1" : timeFrameName;

            if (timeFrameName.Equals(string.Format("Tick{0}", SizeInTicks), StringComparison.OrdinalIgnoreCase))
            {
                return;
            }
            else if (timeFrameName.StartsWith("Tick", StringComparison.Ordinal) && SizeInTicks % Convert.ToInt32(timeFrameName.Substring(TimeFrameNamePrefix.Length), CultureInfo.InvariantCulture) == 0)
            {
                _bars = Bars;
            }
            else
            {
                var timeFrame = GetTimeFrame(SizeInTicks, "tick");

                Chart.TryChangeTimeFrame(timeFrame);

                return;
            }

            _timeFrameSizeRatio = SizeInTicks / GetTimeFrameSize(_bars.TimeFrame.ToString(), TimeFrameNamePrefix);

            _isChartTypeValid = true;

            _bullishBarBodyColor = GetColor(BullishBarBodyColor, BodyOpacity);
            _bearishBarBodyColor = GetColor(BearishBarBodyColor, BodyOpacity);

            _bullishBarWickColor = GetColor(BullishBarWickColor, WicksOpacity);
            _bearishBarWickColor = GetColor(BearishBarWickColor, WicksOpacity);

            //Chart.ColorSettings.BullFillColor = Color.Transparent;
            //Chart.ColorSettings.BearFillColor = Color.Transparent;
            //Chart.ColorSettings.BullOutlineColor = Color.Transparent;
            //Chart.ColorSettings.BearOutlineColor = Color.Transparent;

            for (int barIndex = 0; barIndex < _bars.Count; barIndex++)
            {
                OnBar(barIndex);
            }

            _bars.BarOpened += obj => OnBar(obj.Bars.Count - 1);
        }

        public override void Calculate(int index)
        {
            var bar = _customBars.FirstOrDefault(iBar => Bars.OpenTimes[index] >= iBar.StartTime && Bars.OpenTimes[index] <= iBar.EndTime);

            if (bar == null) return;

            var startBarIndex = Bars.OpenTimes.GetIndexByTime(bar.StartTime);
            var endBarIndex = Bars.OpenTimes.GetIndexByTime(bar.EndTime);

            for (int barIndex = startBarIndex; barIndex <= endBarIndex + 1; barIndex++)
            {
                FillOutputs(barIndex, bar);
            }
        }

        #endregion Overridden methods

        #region Other methods

        private void OnBar(int index)
        {
            if (_isChartTypeValid == false) return;

            if (_lastBarIndex == index) return;

            _lastBarIndex = index;

            var time = _bars.OpenTimes[index];

            if (_lastBar == null || _barNumber == _timeFrameSizeRatio)
            {
                ChangeLastBar(time, index);

                _barNumber = 1;
            }
            else
            {
                _barNumber += 1;
            }

            for (int barIndex = _lastBar.Index; barIndex <= index; barIndex++)
            {
                UpdateLastBar(time, barIndex);
            }

            DrawBar(_lastBar);
        }

        private void FillOutputs(int index, CustomOhlcBar lastBar)
        {
            if (IsOpenOutputEnabled)
            {
                Open[index] = decimal.ToDouble(lastBar.Open);
            }

            if (IsHighOutputEnabled)
            {
                High[index] = decimal.ToDouble(lastBar.High);
            }

            if (IsLowOutputEnabled)
            {
                Low[index] = decimal.ToDouble(lastBar.Low);
            }

            if (IsCloseOutputEnabled)
            {
                Close[index] = decimal.ToDouble(lastBar.Close);
            }
        }

        private Color GetColor(string colorString, int alpha = 255)
        {
            var color = colorString[0] == '#' ? Color.FromHex(colorString) : Color.FromName(colorString);

            return Color.FromArgb(alpha, color);
        }

        private void DrawBar(CustomOhlcBar lastBar)
        {
            string objectName = string.Format("{0}.{1}", lastBar.StartTime.Ticks, _chartObjectNamesSuffix);

            var barBodyColor = lastBar.Open > lastBar.Close ? _bearishBarBodyColor : _bullishBarBodyColor;

            var open = decimal.ToDouble(lastBar.Open);
            var close = decimal.ToDouble(lastBar.Close);

            var bodyRectangle = Area.DrawRectangle(objectName, lastBar.StartTime, open, lastBar.EndTime, close, barBodyColor, BodyThickness, BodyLineStyle);

            bodyRectangle.IsFilled = FillBody;

            if (ShowWicks)
            {
                string upperWickObjectName = string.Format("{0}.UpperWick", objectName);
                string lowerWickObjectName = string.Format("{0}.LowerWick", objectName);

                var barHalfTimeInMinutes = (lastBar.EndTime - _lastBar.StartTime).TotalMinutes / 2;
                var barCenterTime = lastBar.StartTime.AddMinutes(barHalfTimeInMinutes);

                if (lastBar.Open > lastBar.Close)
                {
                    Area.DrawTrendLine(upperWickObjectName, barCenterTime, open, barCenterTime, decimal.ToDouble(lastBar.High), _bearishBarWickColor, WicksThickness, WicksLineStyle);
                    Area.DrawTrendLine(lowerWickObjectName, barCenterTime, close, barCenterTime, decimal.ToDouble(lastBar.Low), _bearishBarWickColor, WicksThickness, WicksLineStyle);
                }
                else
                {
                    Area.DrawTrendLine(upperWickObjectName, barCenterTime, close, barCenterTime, decimal.ToDouble(lastBar.High), _bullishBarWickColor, WicksThickness, WicksLineStyle);
                    Area.DrawTrendLine(lowerWickObjectName, barCenterTime, open, barCenterTime, decimal.ToDouble(lastBar.Low), _bullishBarWickColor, WicksThickness, WicksLineStyle);
                }
            }
        }

        private void ChangeLastBar(DateTime time, int index)
        {
            if (_lastBar != null)
            {
                DrawBar(_lastBar);
            }

            _previousBar = _lastBar;

            _lastBar = new CustomOhlcBar
            {
                StartTime = time,
                Index = index,
                Open = _previousBar == null ? (decimal)_bars.OpenPrices[index] : _previousBar.Close
            };

            _lastBar.Close = _lastBar.Open;
            _lastBar.High = _lastBar.Open;
            _lastBar.Low = _lastBar.Open;

            // Commented because it causes incompatibility issue with version 4.2
            //if (IsLastBar)
            //{
            //    _customBars.Clear();
            //}

            _customBars.Add(_lastBar);
        }

        private void UpdateLastBar(DateTime time, int index)
        {
            _lastBar.Close = (decimal)_bars.ClosePrices[index];
            _lastBar.High = Math.Max((decimal)_bars.HighPrices[index], _lastBar.High);
            _lastBar.Low = Math.Min((decimal)_bars.LowPrices[index], _lastBar.Low);
            _lastBar.EndTime = time;
            _lastBar.Index = index;
        }

        private TimeFrame GetTimeFrame(int sizeInPips, string type)
        {
            var timeFrames = (from timeFrame in TimeFrame.GetType().GetFields()
                              where timeFrame.Name.StartsWith(type, StringComparison.OrdinalIgnoreCase)
                              let timeFrameName = timeFrame.Name.Equals("tick", StringComparison.OrdinalIgnoreCase) ? "Tick1" : timeFrame.Name
                              let timeFrameSize = Convert.ToInt32(timeFrameName.Substring(type.Length))
                              where timeFrameSize <= sizeInPips && sizeInPips % timeFrameSize == 0
                              orderby timeFrameSize descending
                              select new Tuple<TimeFrame, int>(timeFrame.GetValue(null) as TimeFrame, timeFrameSize)).ToArray();

            var bestFitTimeFrame = timeFrames.FirstOrDefault(timeFrame => timeFrame.Item2 <= sizeInPips && sizeInPips % timeFrame.Item2 == 0);

            if (bestFitTimeFrame != null)
                return bestFitTimeFrame.Item1;

            var smallestTimeFrame = timeFrames.LastOrDefault();

            if (smallestTimeFrame != null)
                return smallestTimeFrame.Item1;

            throw new InvalidOperationException(string.Format("Couldn't find a proper time frame for your provided size ({0} Ticks) and type ({1}).", sizeInPips, type));
        }

        private int GetTimeFrameSize(string timeFrameName, string type)
        {
            return timeFrameName.Equals("tick", StringComparison.OrdinalIgnoreCase) ? 1 : Convert.ToInt32(timeFrameName.Substring(type.Length));
        }

        #endregion Other methods
    }

    public class CustomOhlcBar
    {
        public DateTime StartTime { get; set; }

        public DateTime EndTime { get; set; }

        public int Index { get; set; }

        public decimal Open { get; set; }

        public decimal High { get; set; }

        public decimal Low { get; set; }

        public decimal Close { get; set; }
    }
}
Spotware
Joined on 23.09.2013
- Distribution: Free
- Language: C#
- Trading platform: cTrader Automate
- File name: Custom Tick Chart Non-Overlay.algo
- Rating: 0
- Installs: 1721
- Modified: 01/06/2022 09:53

Comments
This indicator allows to create custom Tick charts using existing Tick charts on cTrader. C# trading platform looks quite complex, can be optimized like stickman boost?
I was not interested in trading before my friend introduce this to me. He told me that his profit margin is up to 15%, so, I started immediately:) Now my profile margin is up to 17%:) Highly recommended!
That is utterly untrue, it can never be possible for an ordinary person to get tick data, there are protocols by which only brokers & trading platform owners can get tick data, cTrader by themselve could have putted to increase tick data size option, if it would be so easy to get 10k tick data. Stop making people fool