Description
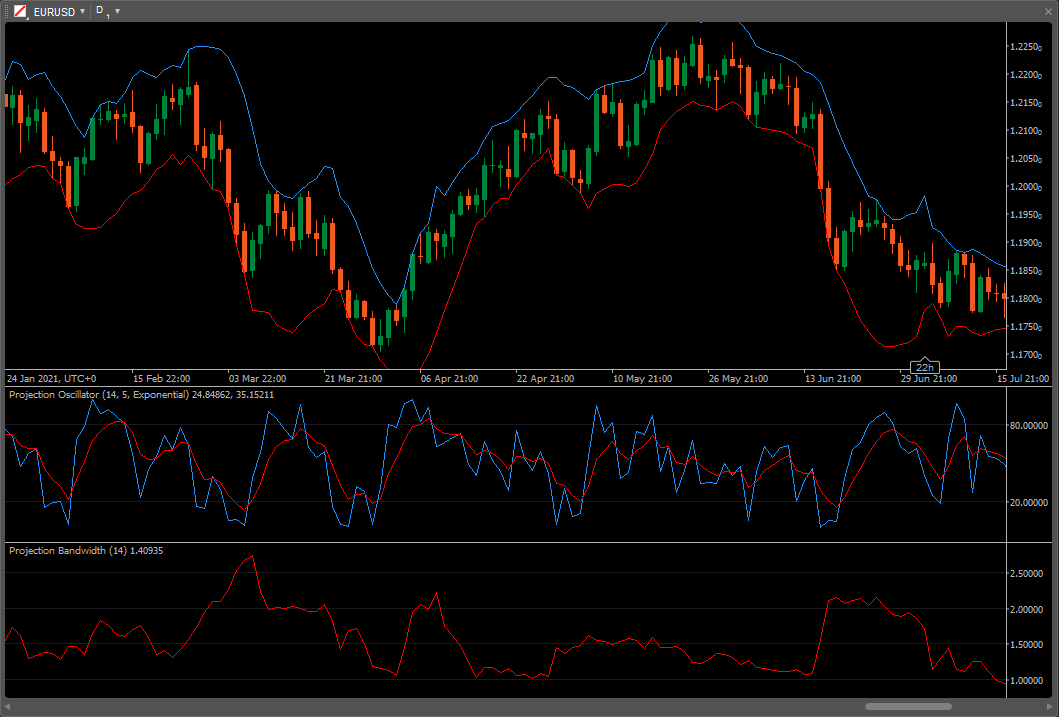
The Projection Oscillator is based on the Projection Bands indicator. The Oscillator calculates where the close lies within the band as a percentage. Therefore, an Oscillator value of 50 would mean that the close is in the middle of the band. A value of 100 would mean that the close is equal to the top band, and zero means that it is equal to the low band. The calculation is similar to a Stochastic which uses the raw highest high and lowest low value, whereas the Projection Oscillator adds the regression line component, making it more sensitive.
The Projection Oscillator can be interpreted several ways. Look for divergence with price to indicate a trend reversal. Extreme values (over 80 or under 20) indicate overbought/oversold levels. A moving average of the oscillator can be used as a trigger line. A buy/sell signal is generated when the Projection Oscillator to cross above/below the trigger line. The signal is stronger if it happens above 70 or below 30.
See also Projection Bands and Projection Bandwidth.
Projection Bands were developed by Mel Widner, Ph.D and were originally introduced in his article in the July, 1995 issue of Technical Analysis of Stocks & Commodities magazine.
Github: GitHub - Doustzadeh/cTrader-Indicator
using System;
using cAlgo.API;
using cAlgo.API.Indicators;

namespace cAlgo
{
    [Levels(20, 80)]
    [Indicator(IsOverlay = false, AccessRights = AccessRights.None)]
    public class ProjectionOscillator : Indicator
    {
        [Parameter("Periods", Group = "PO", DefaultValue = 14)]
        public int Periods { get; set; }

        [Parameter("MA Periods", Group = "Signal", DefaultValue = 5)]
        public int MaPeriods { get; set; }

        [Parameter("MA Type", Group = "Signal", DefaultValue = MovingAverageType.Exponential)]
        public MovingAverageType MaType { get; set; }

        [Output("PO", LineColor = "DodgerBlue")]
        public IndicatorDataSeries PO { get; set; }

        [Output("Signal", LineColor = "Red")]
        public IndicatorDataSeries Signal { get; set; }

        private LinearRegressionSlope LrsHigh, LrsLow;
        private MovingAverage MaSignal;

        protected override void Initialize()
        {
            LrsHigh = Indicators.LinearRegressionSlope(Bars.HighPrices, Periods);
            LrsLow = Indicators.LinearRegressionSlope(Bars.LowPrices, Periods);
            MaSignal = Indicators.MovingAverage(PO, MaPeriods, MaType);
        }

        public override void Calculate(int index)
        {
            double HiBand = Bars.HighPrices[index];
            double LowBand = Bars.LowPrices[index];

            for (int i = 1; i < Periods; i++)
            {
                HiBand = Math.Max(HiBand, Bars.HighPrices.Last(i) + i * LrsHigh.Result[index]);
                LowBand = Math.Min(LowBand, Bars.LowPrices.Last(i) + i * LrsLow.Result[index]);
            }

            PO[index] = 100 * (Bars.ClosePrices[index] - LowBand) / (HiBand - LowBand);
            Signal[index] = MaSignal.Result[index];
        }
    }
}

Doustzadeh
Joined on 20.03.2016
- Distribution: Free
- Language: C#
- Trading platform: cTrader Automate
- File name: Projection Oscillator.algo
- Rating: 0
- Installs: 1077
- Modified: 19/12/2021 23:43

Extreme readings (over 80 or under 20) indicate overbought/oversold conditions. As a trigger line, one may make use of a moving average of the oscillator's value dordle. When the projection oscillator crosses above or below the trigger line, a buy/sell signal is created for the underlying asset.