Description
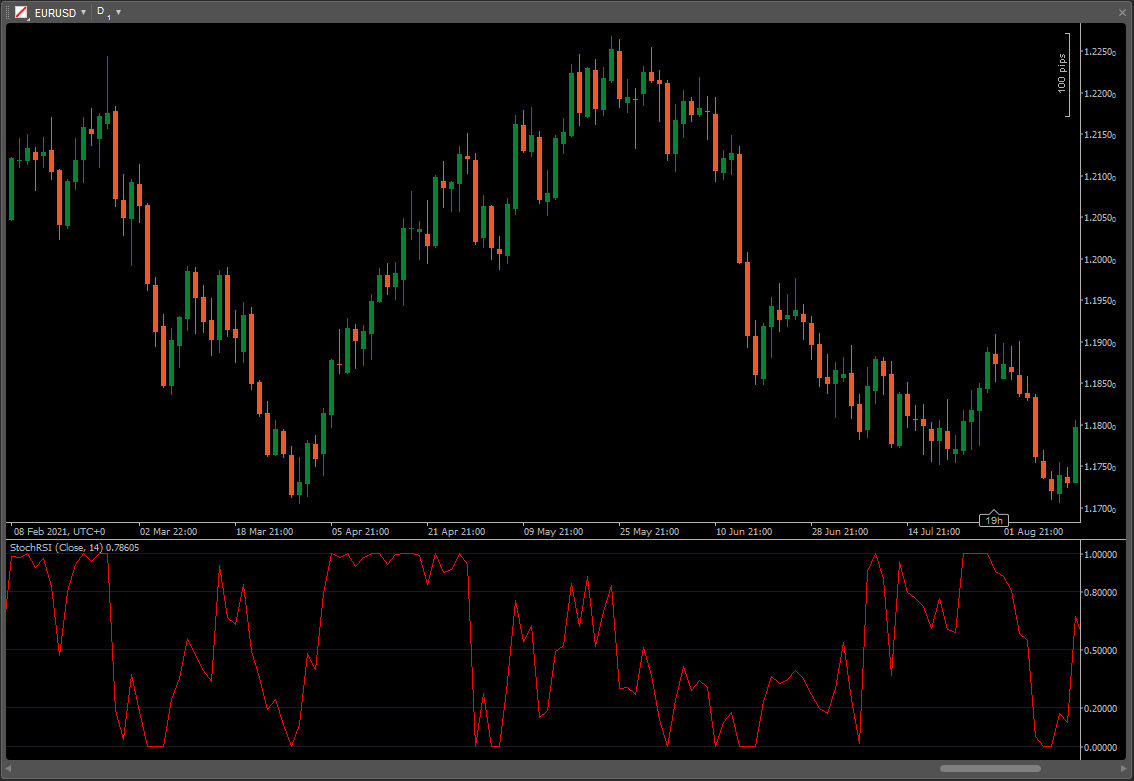
Developed by Tushar Chande and Stanley Kroll, StochRSI is an oscillator that measures the level of RSI relative to its high-low range over a set time period. StochRSI applies the Stochastics formula to RSI values, rather than price values, making it an indicator of an indicator. The result is an oscillator that fluctuates between 0 and 1.
In their 1994 book, The New Technical Trader, Chande and Kroll explain that RSI can oscillate between 80 and 20 for extended periods without reaching extreme levels. Notice that 80 and 20 are used for overbought and oversold instead of the more traditional 70 and 30. Traders looking to enter a stock based on an overbought or oversold reading in RSI might find themselves continuously on the sidelines. Chande and Kroll developed StochRSI to increase sensitivity and generate more overbought/oversold signals.
StochRSI measures the value of RSI relative to its high/low range over a set number of periods. The number of periods used to calculate StochRSI is transferred to RSI in the formula. For example, 14-day StochRSI would use the current value of 14-day RSI and the 14-day high-low range for 14-day RSI.
-
14-day StochRSI equals 0 when RSI is at its lowest point for 14 days.
-
14-day StochRSI equals 1 when RSI is at its highest point for 14 days.
-
14-day StochRSI equals 0.5 when RSI is in the middle of its 14-day high-low range.
-
14-day StochRSI equals 0.2 when RSI is near the low of its 14-day high-low range.
-
14-day StochRSI equals 0.80 when RSI is near the high of its 14-day high-low range.
Github: GitHub - Doustzadeh/cTrader-Indicator
using cAlgo.API;
using cAlgo.API.Indicators;

namespace cAlgo
{
    [Levels(0, 0.2, 0.5, 0.8, 1)]
    [Indicator(IsOverlay = false, AccessRights = AccessRights.None)]
    class StochRSI : Indicator
    {
        // StochRSI = (RSI - Lowest Low RSI) / (Highest High RSI - Lowest Low RSI)

        // 14-day StochRSI equals 0 when RSI is at its lowest point for 14 days
        // 14-day StochRSI equals 1 when RSI is at its highest point for 14 days
        // 14-day StochRSI equals 0.5 when RSI is in the middle of its 14-day high-low range
        // 14-day StochRSI equals 0.2 when RSI is near the low of its 14-day high-low range
        // 14-day StochRSI equals 0.80 when RSI is near the high of its 14-day high-low range

        [Parameter("Source")]
        public DataSeries Source { get; set; }

        [Parameter("Periods", DefaultValue = 14)]
        public int Periods { get; set; }

        [Output("Stoch RSI", LineColor = "Red")]
        public IndicatorDataSeries StochRsi { get; set; }

        private RelativeStrengthIndex RSI;

        protected override void Initialize()
        {
            RSI = Indicators.RelativeStrengthIndex(Source, Periods);
        }

        public override void Calculate(int index)
        {
            StochRsi[index] = (RSI.Result[index] - RSI.Result.Minimum(Periods)) / (RSI.Result.Maximum(Periods) - RSI.Result.Minimum(Periods));
        }
    }
}

Doustzadeh
Joined on 20.03.2016
- Distribution: Free
- Language: C#
- Trading platform: cTrader Automate
- File name: StochRSI.algo
- Rating: 0
- Installs: 2732
- Modified: 07/12/2021 02:19
