Description
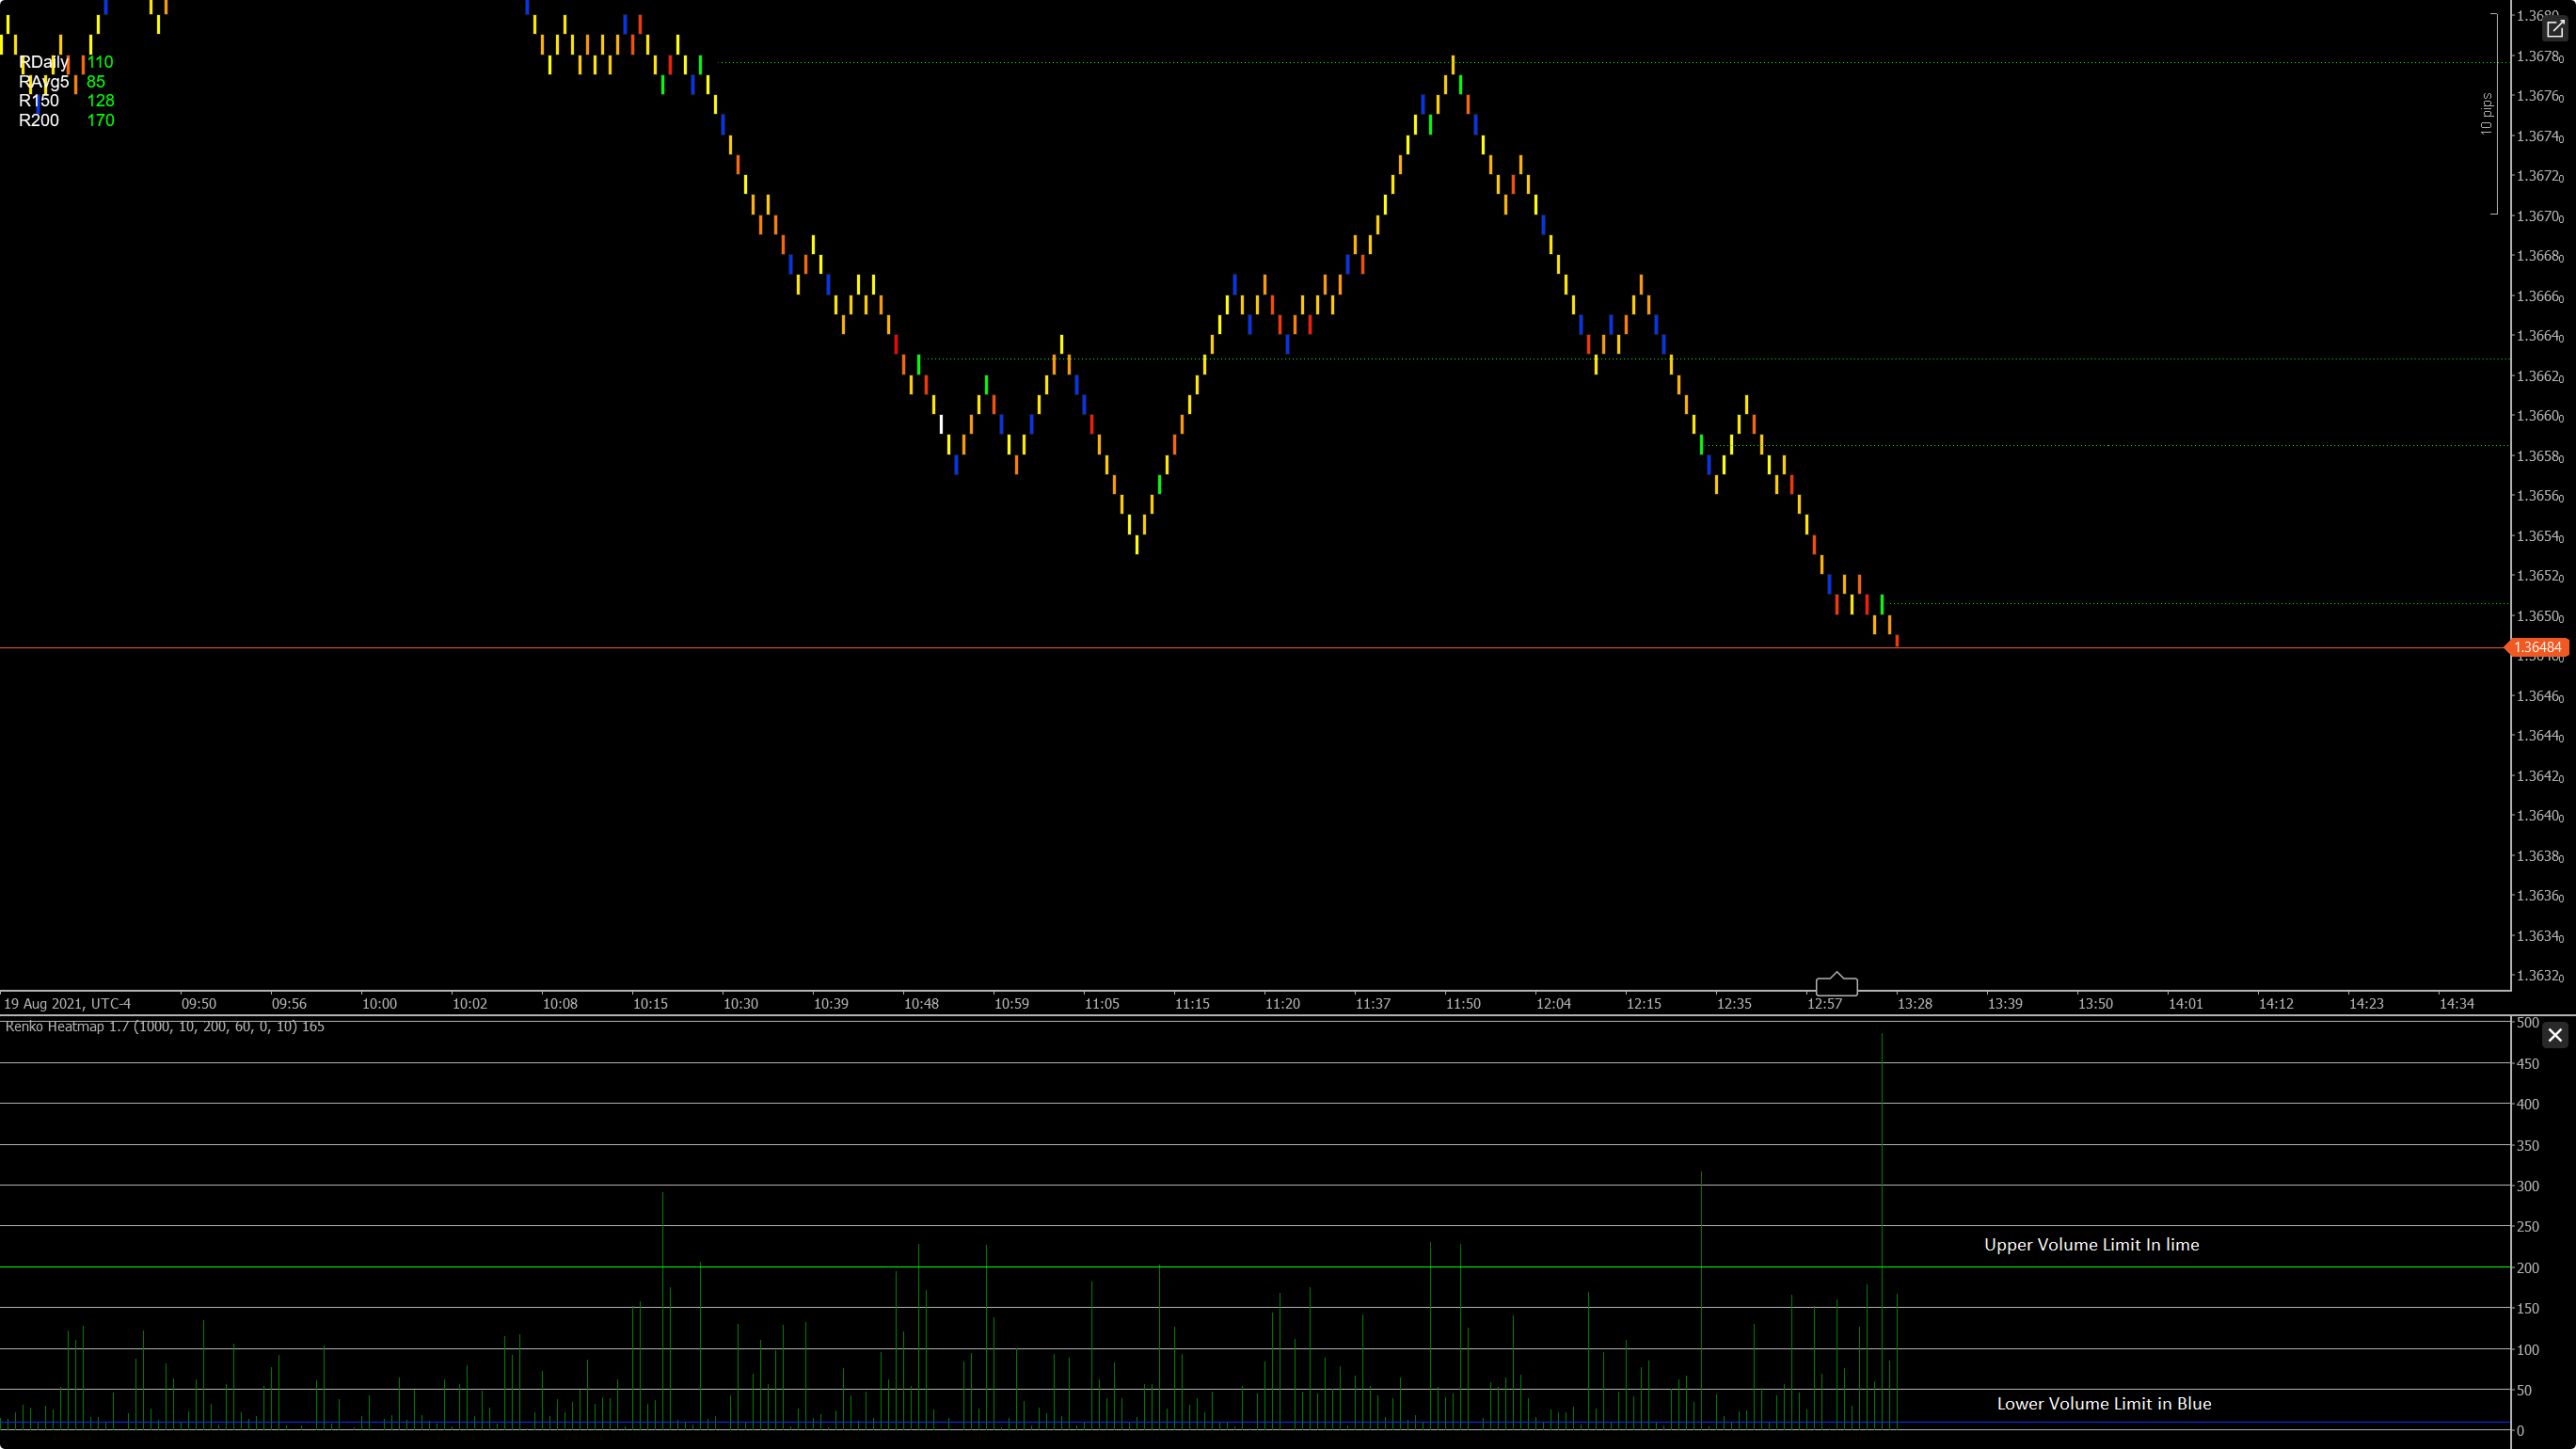
This indicator colours the renko brick according to the volume.
Changing the upper and lower limits will colour the bricks a static colour.
Whilst in between the limits will fade the colour according to the step count.
Example is GU 1 pip
using System;
using System.Linq;
using System.Text;
using System.Threading;
using System.Collections.Generic;
using System.Reflection;
using System.Globalization;
using cAlgo.API;
using cAlgo.API.Indicators;
using cAlgo.API.Internals;
using cAlgo.Indicators;

namespace cAlgo
{
    [Indicator(IsOverlay = false, TimeZone = TimeZones.UTC, AccessRights = AccessRights.None, ScalePrecision = 0)]
    public class indibase : Indicator
    {
        [Parameter("search period", DefaultValue = 1000)]
        public int searchper { get; set; }

        [Parameter("Min Volume", DefaultValue = 10)]
        public int minvol { get; set; }


        [Parameter("Max Volume", DefaultValue = 200)]
        public int maxvol { get; set; }

        [Parameter("Hue Start", DefaultValue = 60)]
        public int startcol { get; set; }


        [Parameter("Hue End", DefaultValue = 0)]
        public int endcol { get; set; }


        [Parameter("Step", DefaultValue = 10)]
        public int step { get; set; }


        [Output("Volume", PlotType = PlotType.Histogram)]
        public IndicatorDataSeries Result { get; set; }


        int numbar = 0;


        Ticks tt;

        protected override void Initialize()
        {
            // Initialize and create nested indicators
            numbar = Bars.OpenPrices.Count;

            Chart.ColorSettings.BullFillColor = Color.Transparent;
            Chart.ColorSettings.BearFillColor = Color.Transparent;
            Chart.ColorSettings.BullOutlineColor = "FF1C1B21";
            Chart.ColorSettings.BearOutlineColor = "FF1C1B21";


            IndicatorArea.DrawHorizontalLine("topline", maxvol, "Lime");

            IndicatorArea.DrawHorizontalLine("botline", minvol, "#FF0033FF");


            ///oldest bar
            ///

            var d0 = Bars.OpenTimes.Last(searchper);

            //load tick data

            tt = MarketData.GetTicks();
            var dxt = tt[0].Time;

            //load until oldest bar
            Print("Load tick started");
            while (dxt > d0)
            {

                tt.LoadMoreHistory();

                Chart.DrawVerticalLine("check T", dxt, "#FF0033FF");
                IndicatorArea.DrawStaticText("loading", "loading" + dxt.ToString(), VerticalAlignment.Center, HorizontalAlignment.Center, "#FF0033FF");
                Print(dxt);
                //Thread.Sleep(100);

                dxt = tt[0].Time;


            }

            Print("Load Finished");
            Print("Calculating...");

            IndicatorArea.RemoveObject("loading");

            Timer.Start(1);
        }


        int tidx = 0;

        public override void Calculate(int index)
        {
            // Calculate value at specified index


            if (index < numbar - searchper - 1)
                return;


            var d0 = Bars.OpenTimes[index];
            var d1 = Bars.OpenTimes[index - 1];


            var volval = getvol(d1, d0);
            var c1 = Bars.ClosePrices[index - 1];

            var o1 = Bars.OpenPrices[index - 1];


            if (volval > 0)
            {
                Result[index - 1] = volval;

                Chart.SetBarFillColor(index - 1, getcol(volval));

                //IndicatorArea.DrawText(d1.ToString(), volval.ToString(), d1, volval, "white");


            }


            if (index == numbar - 1)
            {


                d0 = Bars.OpenTimes.LastValue;

                volval = getvollater(d0, Time);

                Result[index] = volval;


                c1 = Bars.ClosePrices.LastValue;

                o1 = Bars.OpenPrices.LastValue;


                Chart.SetBarFillColor(Bars.Count - 1, getcol(volval));

                //IndicatorArea.DrawText(d0.ToString(), volval.ToString(), d0, volval, "white");


            }

            if (index > numbar - 1)
            {

                numbar++;
            }


            if (double.IsNaN(Result[index - 1]))
                Chart.SetBarFillColor(index - 1, "white");


        }


        int endbar = 0;


        int getvollater(DateTime start, DateTime end)
        {


            int voloutput = 0;

            int i = 0;

            while (tt.Last(i).Time > start)
            {

                voloutput++;
                i++;

            }

            return voloutput;
        }


        int getvol(DateTime start, DateTime end)
        {


            int voloutput = 0;

            var dxt = tt[tidx].Time;


            while (dxt <= start)
            {
                tidx++;
                dxt = tt[tidx].Time;

            }


            while (dxt < end && tidx < tt.Count - 1)
            {

                voloutput++;

                if (start == Bars.OpenTimes.LastValue)
                    endbar++;
                else
                    endbar = 0;

                tidx++;
                dxt = tt[tidx].Time;


            }


            if (start == Bars.OpenTimes.LastValue)
                voloutput = endbar;


            return voloutput;
        }


        string getcol(double vol)
        {

            if (vol < minvol)
                return "#FF0033FF";


            if (vol > maxvol)
                return "Lime";


            var rx = (vol - minvol) / (maxvol - minvol);


            rx = rd(rx * 100);


            string final = gettrans(rx);


            return final;

        }


        string gettrans(double i)
        {

            string output = "";


//steps calculation
            var dx = 100;
            var stepx = dx / step;

            i = Math.Round(i / stepx) * stepx;


            var rn = (int)(i / 100.0 * (endcol - startcol) + startcol);


            var newcol = ColorFromHsl(rn, 1, 0.5);

            output = newcol.ToHexString();


            return output;


        }
        public double r(double val)
        {

            return Math.Round(val, 1);


        }


        public double rd(double val)
        {

            return Math.Round(val, 2);

        }


        public double rdd(double val)
        {

            return Math.Round(val, Symbol.Digits);


        }


        public Color ColorFromHsl(double hue, double saturation, double lightness)
        {
            var p2 = lightness <= 0.5 ? lightness * (1.0 + saturation) : lightness + saturation - lightness * saturation;
            var p1 = 2.0 * lightness - p2;

            double red, green, blue;
            if (saturation <= 0)
            {
                red = lightness;
                green = lightness;
                blue = lightness;
            }
            else
            {
                red = QqhToRgb(p1, p2, hue + 120);
                green = QqhToRgb(p1, p2, hue);
                blue = QqhToRgb(p1, p2, hue - 120);
            }

            return Color.FromArgb((int)(red * 255.0), (int)(green * 255.0), (int)(blue * 255.0));
        }

        private double QqhToRgb(double q1, double q2, double hue)
        {
            if (hue > 360)
                hue -= 360;
            else if (hue < 0)
                hue += 360;

            if (hue < 60)
                return q1 + (q2 - q1) * hue / 60;
            if (hue < 180)
                return q2;
            if (hue < 240)
                return q1 + (q2 - q1) * (240 - hue) / 60;
            return q1;
        }


        //=========================
    }


}
eyeballpaul
Joined on 07.11.2018
- Distribution: Free
- Language: C#
- Trading platform: cTrader Automate
- File name: Renko Heatmap 1.7.algo
- Rating: 0
- Installs: 1673
- Modified: 13/10/2021 09:54

Comments
I looked at the result and compared it with the minute bar volumes. Every random sample I took were wrong!
Several times I took a bar at a random Renko bar within a chart that took several minutes to form. Then I compared the total minute volumes with those of the Renko. I even omitted the first and last minute volumes and yet the volumes on the Heat map were less than (sometimes half) the minute volumes.
I appreciate the efforts of the co-developers who make these kinds of ideas available to others. But I do find it a pity that little or no checks are made on the correctness of the result.
once i use it my cpu jumps to 90% and more.
it consume too much reources and I do not seem to work
By the way I would take the bar color out. That doesn't add much and actually gets in the way a bit and creates confusion.