Description
**************************** WILL ONLY WORK WHEN MARKET IS LIVE
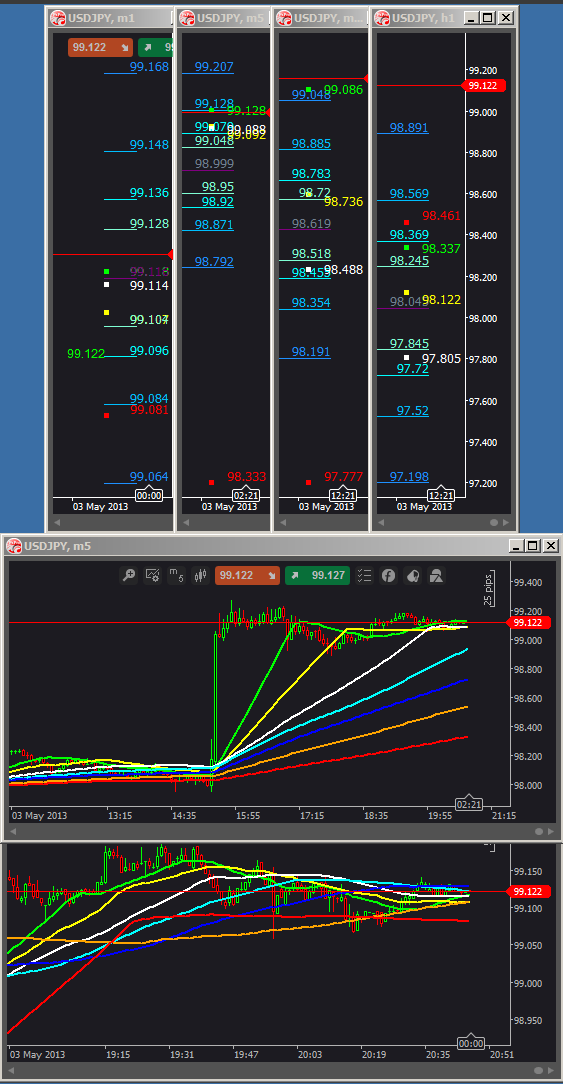
This indicator uses fibonacci simple moving averages and fibonacci bands (/algos/indicators/show/190) to show support and resistance over 4 time frames. They are shown as price and plotted on the chart as below
You will need to open 4 charts 1m, 5m, 15m, 60m build the Average True Range (ATR) indicator first as you will need to referance this in the fibbandsRT indicator (code at bottom)
Then load fiblevelsRT and fibbandsRT indicators (code at bottom of post) resize them so they are like below, you will also have to move the time box to the left a bit to bring it all into view.
For the charts load FibGrid7Chart they will show 7 SMA's that show history, you could also add the fiboonacci bands indicator but I find this get crowded (I use it when looking though historical data)
There are 4 SMA's shown on the real time indicator they are 21sma, 34sma, 55sma and 233sma
The fibonacci bands show 23.60%, 38.00%, 61.80%, and 100.00% from the Average True Range (ATR) both above and below
The FibGrid7Chart Indicator Shows 7 simple moving averages 21sma, 34sma, 55sma, 75sma, 100sma, 144sma and 233sma
// Average True Range ---- Build this first as it needs to referenced in fibbandsRT
using System;
using cAlgo.API;
using cAlgo.API.Indicators;
namespace cAlgo.Indicators
{
[Indicator(IsOverlay = false,ScalePrecision = 5)]
public class averageTrueRange : Indicator
{
[Parameter(DefaultValue = 14, MinValue = 2)]
public int Period { get; set; }
[Output("AverageTrueRange", Color = Colors.Orange)]
public IndicatorDataSeries atr { get; set; }
private ExponentialMovingAverage ema;
public IndicatorDataSeries tr;
private TrueRange tri;
protected override void Initialize()
{
tr = CreateDataSeries();
tri = Indicators.TrueRange();
ema = Indicators.ExponentialMovingAverage(tr,Period);
}
public override void Calculate(int index)
{
if(index<Period+1)
{atr[index] = tri.Result[index];}
if(index>=Period){
atr[index] = (atr[index-1]*(Period-1)+tri.Result[index]) / Period;}
}
}
}
// fibbandsRT --- You need to referance the Average True Range indicator before this will build
using System;
using cAlgo.API;
using cAlgo.API.Indicators;
namespace cAlgo.Indicators
{
[Indicator(IsOverlay = true)]
public class fibbandsRT : Indicator
{
private averageTrueRange _averageTrueRange;
private ExponentialMovingAverage _exponentialMovingAverage;
[Parameter(DefaultValue = 55)]
public int PeriodEma { get; set; }
[Parameter(DefaultValue = 21)]
public int PeriodAtr { get; set; }
[Output("Upper Band 1", Color = Colors.Aqua)]
public IndicatorDataSeries UpperBand1 { get; set; }
[Output("Upper Band 2", Color = Colors.DeepSkyBlue)]
public IndicatorDataSeries UpperBand2 { get; set; }
[Output("Upper Band 3", Color = Colors.DodgerBlue)]
public IndicatorDataSeries UpperBand3 { get; set; }
[Output("Upper Band 4", Color = Colors.Aquamarine)]
public IndicatorDataSeries UpperBand4 { get; set; }
[Output("Lower Band 1", Color = Colors.Aqua)]
public IndicatorDataSeries LowerBand1 { get; set; }
[Output("Lower Band 2", Color = Colors.DeepSkyBlue)]
public IndicatorDataSeries LowerBand2 { get; set; }
[Output("Lower Band 3", Color = Colors.DodgerBlue)]
public IndicatorDataSeries LowerBand3 { get; set; }
[Output("Lower Band 4", Color = Colors.Aquamarine)]
public IndicatorDataSeries LowerBand4 { get; set; }
[Output("EMA", Color = Colors.SlateGray)]
public IndicatorDataSeries Ema { get; set; }
protected override void Initialize()
{
_averageTrueRange = Indicators.GetIndicator<averageTrueRange>(PeriodAtr);
_exponentialMovingAverage = Indicators.ExponentialMovingAverage(MarketSeries.Close, PeriodEma);
}
public override void Calculate(int index)
{
if (!IsRealTime) return;
for (int i = index - 10; i <= index; i++)
{
double ema = _exponentialMovingAverage.Result[index];
double atr = _averageTrueRange.atr[index];
UpperBand1[i] = ema + 1.62*atr;
UpperBand2[i] = ema + 2.62*atr;
UpperBand3[i] = ema + 4.23*atr;
UpperBand4[i] = ema + 1*atr;
LowerBand1[i] = ema - 1.62*atr;
LowerBand2[i] = ema - 2.62*atr;
LowerBand3[i] = ema - 4.23*atr;
LowerBand4[i] = ema - 1*atr;
Ema[i] = ema;
}
for (int i = 0; i < index - 10; i++)
{
UpperBand1[i] = double.NaN;
UpperBand2[i] = double.NaN;
UpperBand3[i] = double.NaN;
UpperBand4[i] = double.NaN;
LowerBand1[i] = double.NaN;
LowerBand2[i] = double.NaN;
LowerBand3[i] = double.NaN;
LowerBand4[i] = double.NaN;
Ema[i] = double.NaN;
}
int xPos = index + 0;
double yPos = UpperBand1[index];
string text = String.Format("{0}", Math.Round(yPos, Symbol.Digits));
ChartObjects.DrawText("obj1", text, xPos, yPos, VerticalAlignment.Top, HorizontalAlignment.Left, Colors.Aqua);
yPos = UpperBand2[index];
text = String.Format("{0}", Math.Round(yPos, Symbol.Digits));
ChartObjects.DrawText("obj2", text, xPos, yPos, VerticalAlignment.Top, HorizontalAlignment.Left,
Colors.DeepSkyBlue);
yPos = UpperBand3[index];
text = String.Format("{0}", Math.Round(yPos, Symbol.Digits));
ChartObjects.DrawText("obj3", text, xPos, yPos, VerticalAlignment.Top, HorizontalAlignment.Left,
Colors.DodgerBlue);
yPos = UpperBand4[index];
text = String.Format("{0}", Math.Round(yPos, Symbol.Digits));
ChartObjects.DrawText("obj4", text, xPos, yPos, VerticalAlignment.Top, HorizontalAlignment.Left, Colors.Aquamarine);
yPos = LowerBand1[index];
text = String.Format("{0}", Math.Round(yPos, Symbol.Digits));
ChartObjects.DrawText("obj5", text, xPos, yPos, VerticalAlignment.Top, HorizontalAlignment.Left, Colors.Aqua);
yPos = LowerBand2[index];
text = String.Format("{0}", Math.Round(yPos, Symbol.Digits));
ChartObjects.DrawText("obj6", text, xPos, yPos, VerticalAlignment.Top, HorizontalAlignment.Left,
Colors.DeepSkyBlue);
yPos = LowerBand3[index];
text = String.Format("{0}", Math.Round(yPos, Symbol.Digits));
ChartObjects.DrawText("obj7", text, xPos, yPos, VerticalAlignment.Top, HorizontalAlignment.Left,
Colors.DodgerBlue);
yPos = LowerBand4[index];
text = String.Format("{0}", Math.Round(yPos, Symbol.Digits));
ChartObjects.DrawText("obj8", text, xPos, yPos, VerticalAlignment.Top, HorizontalAlignment.Left, Colors.Aquamarine);
yPos = Ema[index];
text = String.Format("{0}", Math.Round(yPos, Symbol.Digits));
ChartObjects.DrawText("obj9", text, xPos, yPos, VerticalAlignment.Top, HorizontalAlignment.Left, Colors.SlateGray);
}
}
}
// fiblevelsRT indicator
using System;
using cAlgo.API;
using cAlgo.API.Indicators;
namespace cAlgo.Indicators
{
[Indicator(IsOverlay = true)]
public class fiblevelsRT : Indicator
{
private fiblevelsRT fiblevelsRTIndicator;
[Parameter]
public DataSeries Source { get; set; }
[Parameter("L1", DefaultValue = 21)]
public int Periods { get; set; }
[Parameter("L2", DefaultValue = 34)]
public int Periods2 { get; set; }
[Parameter("L3", DefaultValue = 55)]
public int Periods3 { get; set; }
[Parameter("L7", DefaultValue = 233)]
public int Periods7 { get; set; }
[Output("Level1", Color = Colors.Lime, Thickness = 5, LineStyle = LineStyle.DotsVeryRare)]
public IndicatorDataSeries Result { get; set; }
[Output("Level2", Color = Colors.Yellow, Thickness = 5, LineStyle = LineStyle.DotsVeryRare)]
public IndicatorDataSeries Result2 { get; set; }
[Output("Level3", Color = Colors.White, Thickness = 5, LineStyle = LineStyle.DotsVeryRare)]
public IndicatorDataSeries Result3 { get; set; }
[Output("Level7", Color = Colors.Red, Thickness = 5, LineStyle = LineStyle.DotsVeryRare)]
public IndicatorDataSeries Result7 { get; set; }
private SimpleMovingAverage _simpleMovingAverage1;
private SimpleMovingAverage _simpleMovingAverage2;
private SimpleMovingAverage _simpleMovingAverage3;
private SimpleMovingAverage _simpleMovingAverage7;
protected override void Initialize()
{
_simpleMovingAverage1 = Indicators.SimpleMovingAverage(Source, Periods);
_simpleMovingAverage2 = Indicators.SimpleMovingAverage(Source, Periods2);
_simpleMovingAverage3 = Indicators.SimpleMovingAverage(Source, Periods3);
_simpleMovingAverage7 = Indicators.SimpleMovingAverage(Source, Periods7);
}
public override void Calculate(int index)
{
if (!IsRealTime) return;
for (int i = index - 10; i <= index; i++)
{
Result[i] = _simpleMovingAverage1.Result[index];
Result2[i] = _simpleMovingAverage2.Result[index];
Result3[i] = _simpleMovingAverage3.Result[index];
Result7[i] = _simpleMovingAverage7.Result[index];
}
for(int i = 0; i < index - 10; i++)
{
Result[i] = double.NaN;
Result2[i] = double.NaN;
Result3[i] = double.NaN;
Result7[i] = double.NaN;
}
int xPos = index + 1;
double yPos = _simpleMovingAverage1.Result[index];
var text = String.Format("{0}", Math.Round(yPos, Symbol.Digits));
ChartObjects.DrawText("obj1", text, xPos, yPos, VerticalAlignment.Center, HorizontalAlignment.Left,Colors.Lime);
yPos = _simpleMovingAverage2.Result[index];
text = String.Format("{0}", Math.Round(yPos, Symbol.Digits));
ChartObjects.DrawText("obj2", text, xPos, yPos, VerticalAlignment.Bottom, HorizontalAlignment.Left,Colors.Yellow);
yPos = _simpleMovingAverage3.Result[index];
text = String.Format("{0}", Math.Round(yPos, Symbol.Digits));
ChartObjects.DrawText("obj3", text, xPos, yPos, VerticalAlignment.Center, HorizontalAlignment.Left,Colors.White);
yPos = _simpleMovingAverage7.Result[index];
text = String.Format("{0}", Math.Round(yPos, Symbol.Digits));
ChartObjects.DrawText("obj7", text, xPos, yPos, VerticalAlignment.Top, HorizontalAlignment.Left, Colors.Red);
}
}
}
// FibGrid7Chart Indicator --- 7 simple moving averages
using System;
using cAlgo.API;
using cAlgo.API.Indicators;
namespace cAlgo.Indicators
{
[Indicator(IsOverlay = true)]
public class FibGrid7Chart : Indicator
{
[Parameter]
public DataSeries Source { get; set; }
[Parameter("L1", DefaultValue = 21)]
public int Periods { get; set; }
[Parameter("L2", DefaultValue = 34)]
public int Periods2 { get; set; }
[Parameter("L3", DefaultValue = 55)]
public int Periods3 { get; set; }
[Parameter("L4", DefaultValue = 75)]
public int Periods4 { get; set; }
[Parameter("L5", DefaultValue = 100)]
public int Periods5 { get; set; }
[Parameter("L6", DefaultValue = 144)]
public int Periods6 { get; set; }
[Parameter("L7", DefaultValue = 233)]
public int Periods7 { get; set; }
[Output("Level1", Color = Colors.Lime, Thickness = 3)]
public IndicatorDataSeries Result { get; set; }
[Output("Level2", Color = Colors.Yellow, Thickness = 3)]
public IndicatorDataSeries Result2 { get; set; }
[Output("Level3", Color = Colors.White, Thickness = 3)]
public IndicatorDataSeries Result3 { get; set; }
[Output("Level4", Color = Colors.Aqua, Thickness = 3)]
public IndicatorDataSeries Result4 { get; set; }
[Output("Level5", Color = Colors.Blue, Thickness = 3)]
public IndicatorDataSeries Result5 { get; set; }
[Output("Level6", Color = Colors.Orange, Thickness = 3)]
public IndicatorDataSeries Result6 { get; set; }
[Output("Level7", Color = Colors.Red, Thickness = 3)]
public IndicatorDataSeries Result7 { get; set; }
private SimpleMovingAverage _simpleMovingAverage1;
private SimpleMovingAverage _simpleMovingAverage2;
private SimpleMovingAverage _simpleMovingAverage3;
private SimpleMovingAverage _simpleMovingAverage4;
private SimpleMovingAverage _simpleMovingAverage5;
private SimpleMovingAverage _simpleMovingAverage6;
private SimpleMovingAverage _simpleMovingAverage7;
protected override void Initialize()
{
_simpleMovingAverage1 = Indicators.SimpleMovingAverage(Source, Periods);
_simpleMovingAverage2 = Indicators.SimpleMovingAverage(Source, Periods2);
_simpleMovingAverage3 = Indicators.SimpleMovingAverage(Source, Periods3);
_simpleMovingAverage4 = Indicators.SimpleMovingAverage(Source, Periods4);
_simpleMovingAverage5 = Indicators.SimpleMovingAverage(Source, Periods5);
_simpleMovingAverage6 = Indicators.SimpleMovingAverage(Source, Periods6);
_simpleMovingAverage7 = Indicators.SimpleMovingAverage(Source, Periods7);
}
public override void Calculate(int index)
{
Result[index] = _simpleMovingAverage1.Result[index];
Result2[index] = _simpleMovingAverage2.Result[index];
Result3[index] = _simpleMovingAverage3.Result[index];
Result4[index] = _simpleMovingAverage4.Result[index];
Result5[index] = _simpleMovingAverage5.Result[index];
Result6[index] = _simpleMovingAverage6.Result[index];
Result7[index] = _simpleMovingAverage7.Result[index];
}
}
}
If anyone wants the modified 1m that shows the price and lays out the fibs let me know
I would also like to thank support for all there hard work in helping me build this indicator (like 99% I've just modified)
Scott
u

Scott
Joined on 18.01.2013
- Distribution: Free
- Language: C#
- Trading platform: cTrader Automate
- File name: Real Time Fibonacci Indicators.algo
- Rating: 2.5
- Installs: 7929
- Modified: 13/10/2021 09:54

Comments


hi,
i m very new.
how do i get from indicator to Cbots?