Warning! This section will be deprecated on February 1st 2025. Please move all your Indicators to the cTrader Store catalogue.
Description
This indicator overlays RSI on the main chart.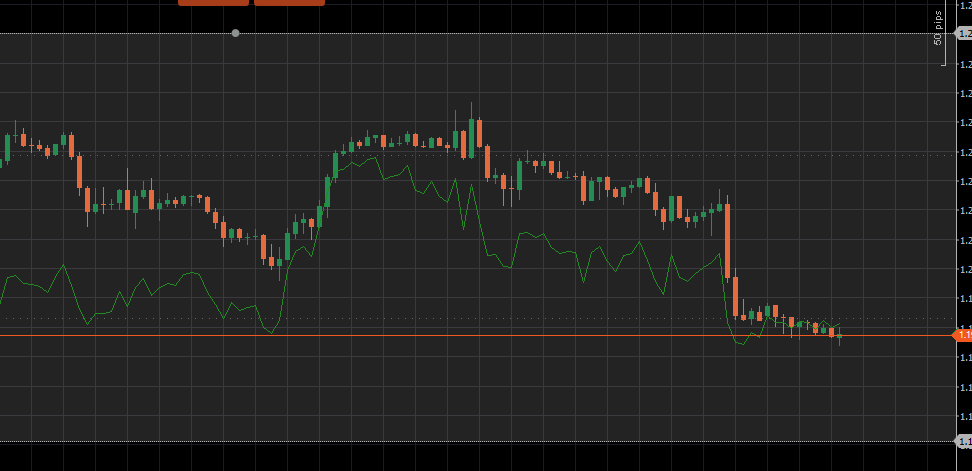
Other tools can be downloaded from Gumroad.
using System;
using cAlgo.API;
using cAlgo.API.Internals;
using cAlgo.API.Indicators;
using cAlgo.Indicators;

namespace cAlgo
{
    [Indicator(IsOverlay = true, TimeZone = TimeZones.UTC, AccessRights = AccessRights.None)]
    public class OverlayRSI : Indicator
    {
        [Parameter(DefaultValue = "Close")]
        public DataSeries Source { get; set; }

        [Parameter(DefaultValue = 14, MinValue = 1)]
        public int Period { get; set; }

        [Parameter(DefaultValue = 50, MinValue = 0, MaxValue =100)]
        public int BackgroundOpacity { get; set; }

        [Parameter(DefaultValue = 30, MinValue = 0, MaxValue =100, Step = 1, Group ="Levels")]
        public double UpperLevel { get; set; }
        [Parameter(DefaultValue = "dimgray", Group = "Levels")]
        public string UpperColor { get; set; }

        [Parameter(DefaultValue = 70, MinValue = 0, MaxValue =100, Step = 1, Group = "Levels")]
        public double LowerLevel { get; set; }
        [Parameter(DefaultValue = "dimgray", MinValue = 0, MaxValue = 100, Step = 1, Group = "Levels")]
        public string LowerColor { get; set; }

        [Output("RSI")]
        public IndicatorDataSeries Result { get; set; }

        private RelativeStrengthIndex _rsi;
        private ChartHorizontalLine _upperLine;
        private ChartHorizontalLine _lowerLine;
        private ChartRectangle _backRect;
        private double _convert(double val) { return val * (_upperLine.Y - _lowerLine.Y) / 100 + _lowerLine.Y; }

        protected override void Initialize()
        {
            _rsi = Indicators.RelativeStrengthIndex(Source, Period);
            var color = Chart.ColorSettings.ForegroundColor;
            _upperLine = Chart.DrawHorizontalLine("upper_line", (Chart.TopY-Chart.BottomY)*0.9+Chart.BottomY, color, 1, LineStyle.Dots);
            _lowerLine = Chart.DrawHorizontalLine("lower_line", (Chart.TopY - Chart.BottomY) * 0.1 + Chart.BottomY, color, 1, LineStyle.Dots);
            _backRect = Chart.DrawRectangle("back_rect", Bars.OpenTimes[0], _upperLine.Y, Time+TimeSpan.FromDays(360) , _lowerLine.Y, Color.FromArgb(BackgroundOpacity, color));
            _backRect.IsFilled = true;
            var upperLevel = Chart.DrawHorizontalLine("upper_leves", _convert(UpperLevel), Color.FromName(UpperColor), 1, LineStyle.DotsVeryRare);
            var lowerLevel = Chart.DrawHorizontalLine("lower_leves", _convert(LowerLevel), Color.FromName(LowerColor), 1, LineStyle.DotsVeryRare);
            _upperLine.IsInteractive = _lowerLine.IsInteractive = true;

            Chart.ObjectUpdated += args => {
                var name = args.ChartObject.Name;
                if (name == _upperLine.Name || name == _lowerLine.Name) {
                    _backRect.Y1 = _upperLine.Y;
                    _backRect.Y2 = _lowerLine.Y;
                    upperLevel.Y = _convert(UpperLevel);
                    lowerLevel.Y = _convert(LowerLevel);
                    for (int i = 0; i < Bars.Count; i++) Calculate(i);
                }
            };

        }

        public override void Calculate(int index)
        {
            Result[index] = _convert(_rsi.Result[index]);
        }
    }
}

ajinori
Joined on 06.10.2020
- Distribution: Free
- Language: C#
- Trading platform: cTrader Automate
- File name: Overlay RSI.algo
- Rating: 0
- Installs: 2057
- Modified: 13/10/2021 09:54

Note that publishing copyrighted material is strictly prohibited. If you believe there is copyrighted material in this section, please use the Copyright Infringement Notification form to submit a claim.
Comments
Log in to add a comment.
No comments found.