Description
Version 2.
Changes introduced:
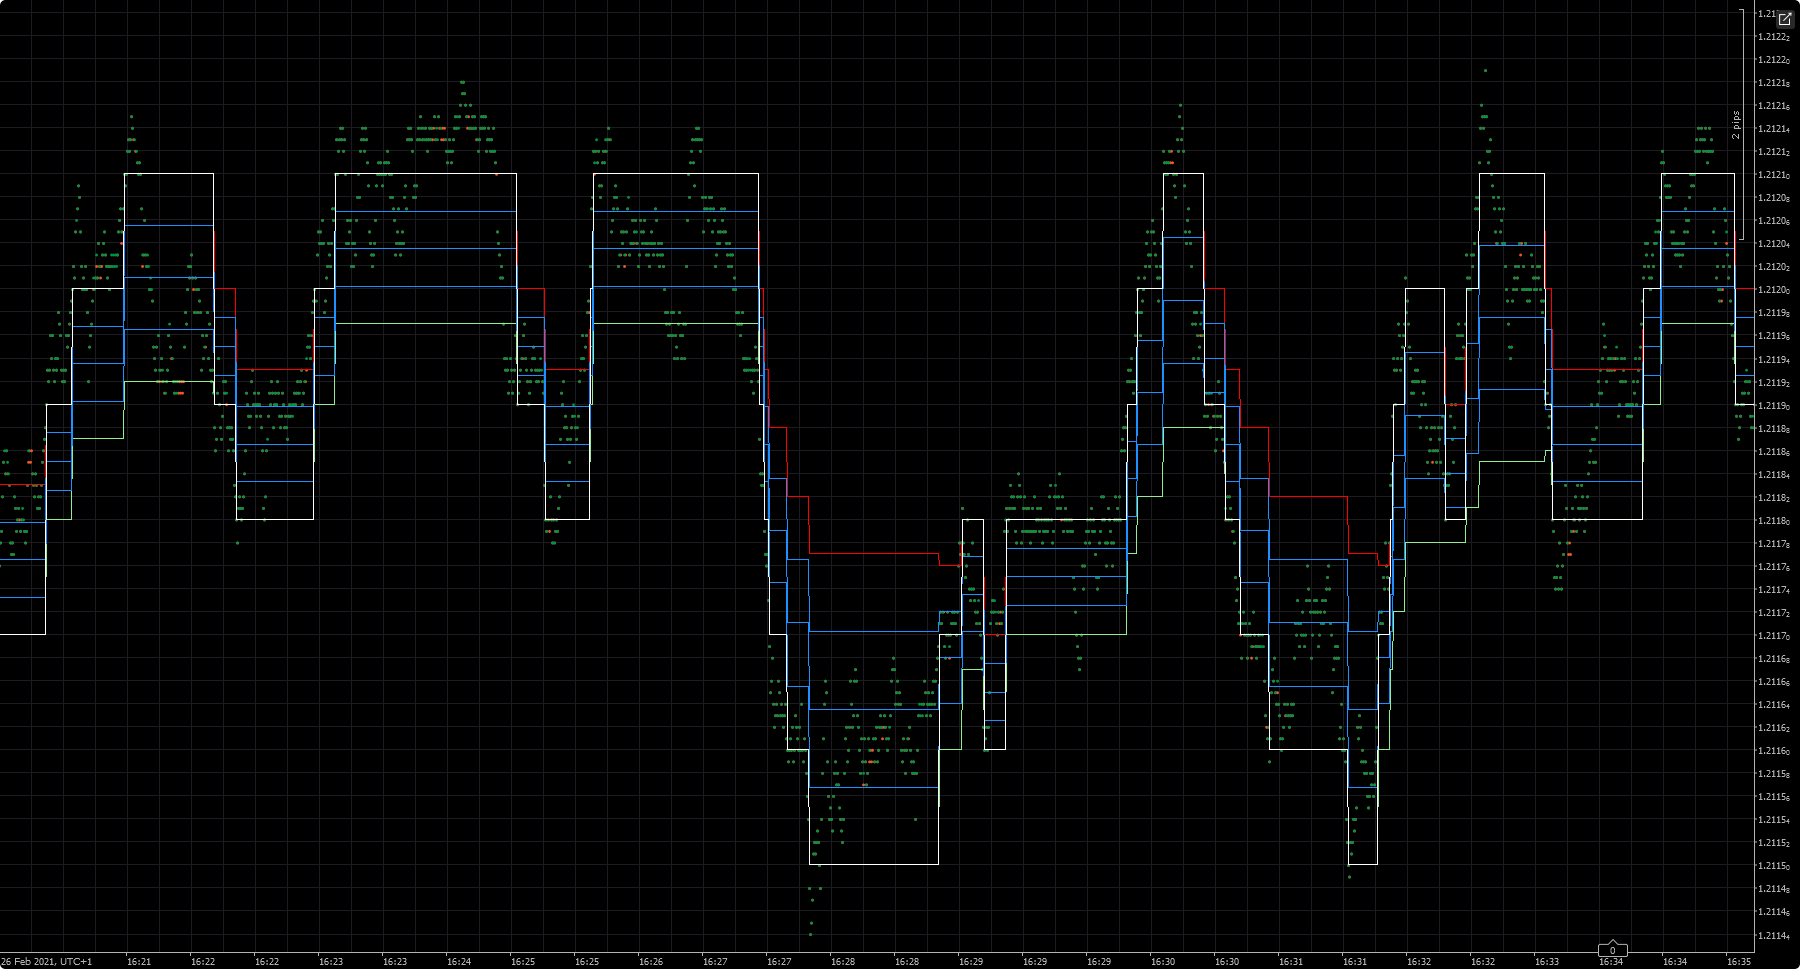
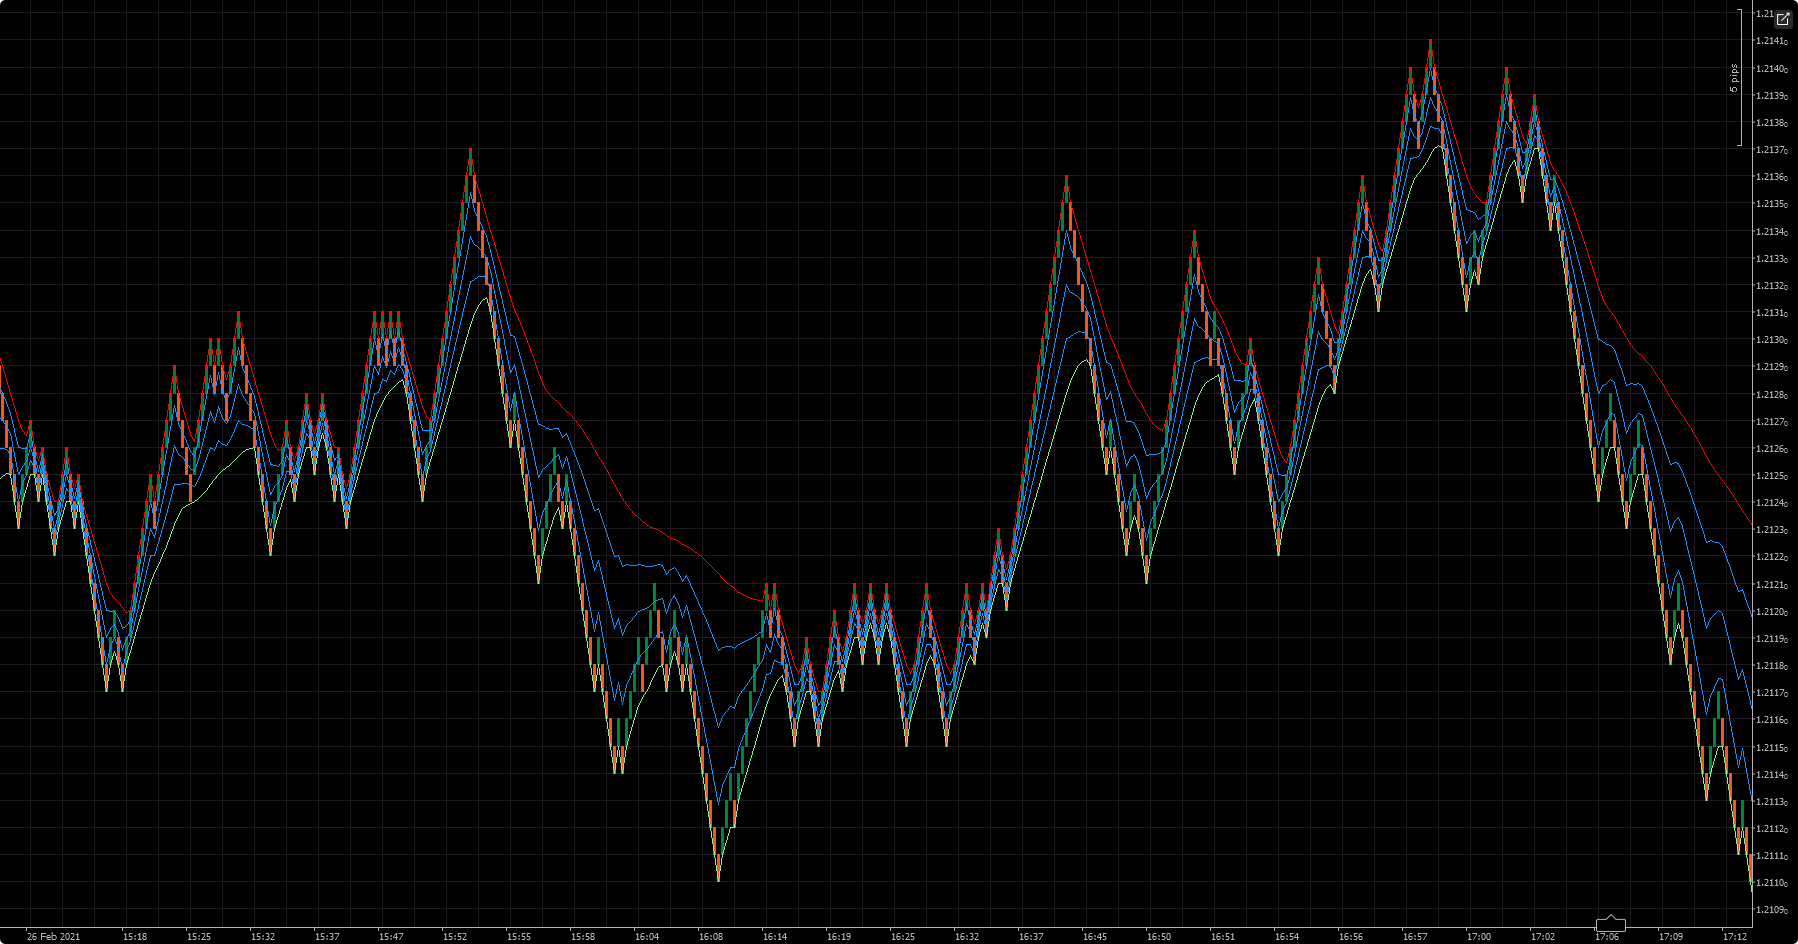
Two pips required to turn around as in Renko.
Recalculation of balance lines.
Te next step:
To add a parameter to customize the brick size.
(I think I will continue with these things until I find a girlfriend or get lucky in Euromillions).
(Curiously rounding I get everything squared).
Be happy xD
TFt1

The indicator only draws the renko chart and its breakeven lines on TFt1 to observe the price action in detail.

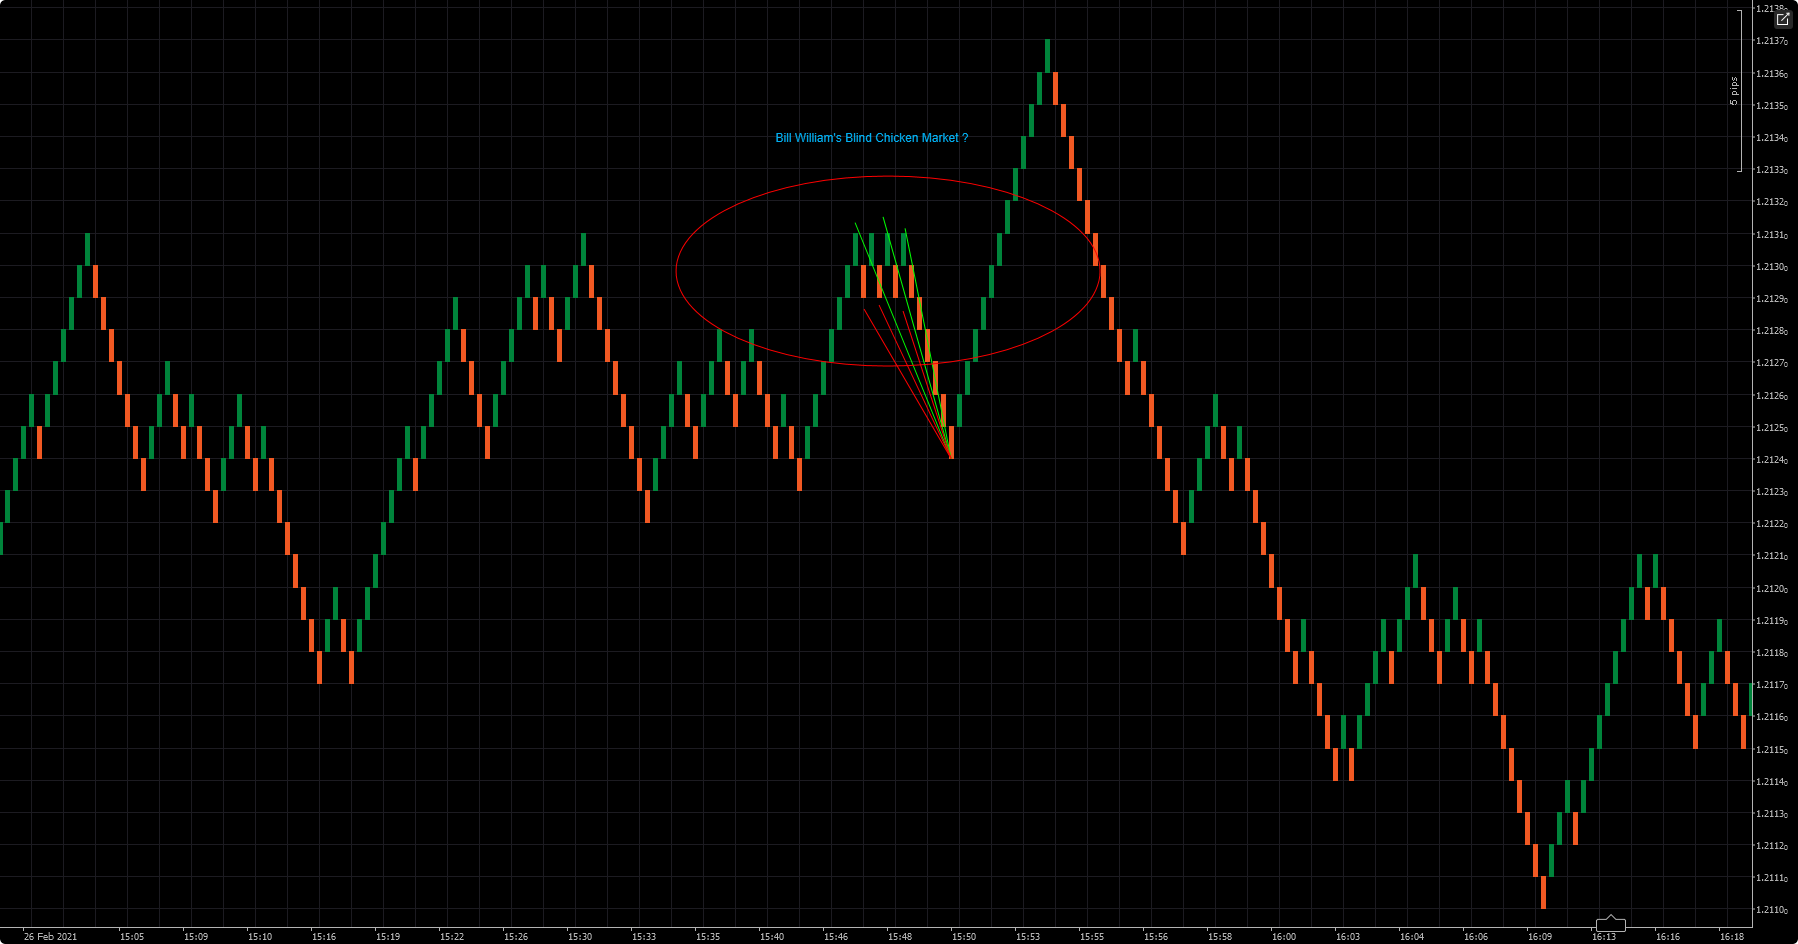
It seems to me that the famous trader Bill Williams once said: "If you feed the chickens at the same time every day, even a blind chicken will find its food." Well, sometimes the market seems to take a rest and move in a two pip range over a ten or twelve minute period. Buying in support and selling in resistance, there are always two pips of profit. It doesn't matter which direction the market takes later. You need to consider the commissions and the spread. The number of bullish and bearish positions must be equal. Of course there is always risk. I think Bill Williams was referring to these periods when market supervisors seem to be taking their well-deserved rest. I hope I don't disturb anyone with my peculiar sense of humor. I understand that trading is hard but I think that good humor can extend life.
I only propose this possible strategy as an example so that each one can find their own way. Thank you very much Mr. Williams for your teachings

using System;
using cAlgo.API;
using cAlgo.API.Internals;
using cAlgo.API.Indicators;
using cAlgo.Indicators;

namespace cAlgo
{
    [Indicator(IsOverlay = true, TimeZone = TimeZones.UTC, AccessRights = AccessRights.None)]
    public class MRPLOverlay : Indicator
    {
        [Output("Result1", LineColor = "lightGreen")]
        public IndicatorDataSeries Result1 { get; set; }

        [Output("Result2", LineColor = "Red")]
        public IndicatorDataSeries Result2 { get; set; }

        [Output("Result3", LineColor = "DodgerBlue")]
        public IndicatorDataSeries Result3 { get; set; }

        [Output("Result4", LineColor = "DodgerBlue")]
        public IndicatorDataSeries Result4 { get; set; }

        [Output("Result5", LineColor = "DodgerBlue")]
        public IndicatorDataSeries Result5 { get; set; }

        [Output("Result6", LineColor = "White")]
        public IndicatorDataSeries Result6 { get; set; }

        private double price, previousLevel, result;
        private IndicatorDataSeries level;
        private bool bullish, bearish;

        private int buyCount, sellCount;
        private int savedbc, savedsc;
        private double buySum, sellSum;
        private double savedbs, savedss;

        private double buyAverage;
        private double sellAverage;
        private double CenterMean, UpperMean, LowerMean;

        protected override void Initialize()
        {
            level = CreateDataSeries();
            previousLevel = Math.Round(Bars.ClosePrices.LastValue, 4);
            bullish = true;
            bearish = false;
        }

        public override void Calculate(int index)
        {
            price = Bars.ClosePrices[index];
            level[index] = Math.Round(price, 4);

            if (level[index] > previousLevel)
                if (price < level[index])
                    level[index] = level[index] - 0.0001;

            if (level[index] < previousLevel)
                if (price > level[index])
                    level[index] = level[index] + 0.0001;

            result = Math.Round(level[index] - previousLevel, 4);

            if (bullish)
            {
                if (result == -0.0001)
                    level[index] = level[index] + 0.0001;
                if (result == -0.0002 || result < -0.0002)
                {
                    bullish = false;
                    bearish = true;
                }
            }

            if (bearish)
            {
                if (result == 0.0001)
                    level[index] = level[index] - 0.0001;
                if (result == 0.0002 || result > 0.0002)
                {
                    bullish = true;
                    bearish = false;
                }
            }

            result = Math.Round(level[index] - previousLevel, 4);

            //---------------------------------------------------------------------------------------------------------------------------------------------------------

            if (result != 0)
            {
                buyCount++;
                buySum += level[index];

                sellCount++;
                sellSum += level[index];
            }

            //---------------------------------------------------------------------------------------------------------------------------------------------------------

            buyAverage = Math.Round(buySum / buyCount, 5);
            sellAverage = Math.Round(sellSum / sellCount, 5);

            //---------------------------------------------------------------------------------------------------------------------------------------------------------

            if (level[index] > buyAverage)
            {
                buyAverage = level[index];
                buyCount = 1;
                buySum = level[index];
            }

            if (level[index] < sellAverage)
            {
                sellAverage = level[index];
                sellCount = 1;
                sellSum = level[index];
            }

            CenterMean = (buyAverage + sellAverage) / 2;
            UpperMean = (buyAverage + CenterMean) / 2;
            LowerMean = (CenterMean + sellAverage) / 2;

            Result1[index] = sellAverage;
            Result2[index] = buyAverage;
            Result3[index] = CenterMean;
            Result4[index] = UpperMean;
            Result5[index] = LowerMean;
            Result6[index] = level[index];

            previousLevel = level[index];
        }
    }
}
srm_bcn
Joined on 01.09.2019
- Distribution: Free
- Language: C#
- Trading platform: cTrader Automate
- File name: MRPLOverlay2.algo
- Rating: 0
- Installs: 1139
- Modified: 13/10/2021 09:54
Comments
Walgreens discovered the need to listen to its customers in order to develop and enhance its services and goods, which led to the creation of WalgreensListens.com. Visit here - WalgreensListens Survey
We will go through the specifics of Kroger's customer survey and how customers can take part in this post.
visit here KrogerFeedback Survey
You have a wonderful opportunity to share your thoughts on the restaurant's T.G.I. Friday's Menu and Customer Service Standards, food quality, and restaurant cleanliness through the TalktoFridays.
visit here TalkToFridays Survey
DGCustomerFirst - The company stores the opinions and evaluations of their highly valued clients using this survey arrangement.
The company stores the opinions and evaluations of their highly valued clients using this survey arrangement. <a href="https://dgcustomerfirstcom.run/"> For more info DGCustomerFirst Survey </a>

Your suggestions will enable them to improve the calibre of their offerings, guaranteeing that each time you visit an Acme Markets location, you will have a great and satisfying experience.
Visit here Acmemarketssurvey.com Survey