Description
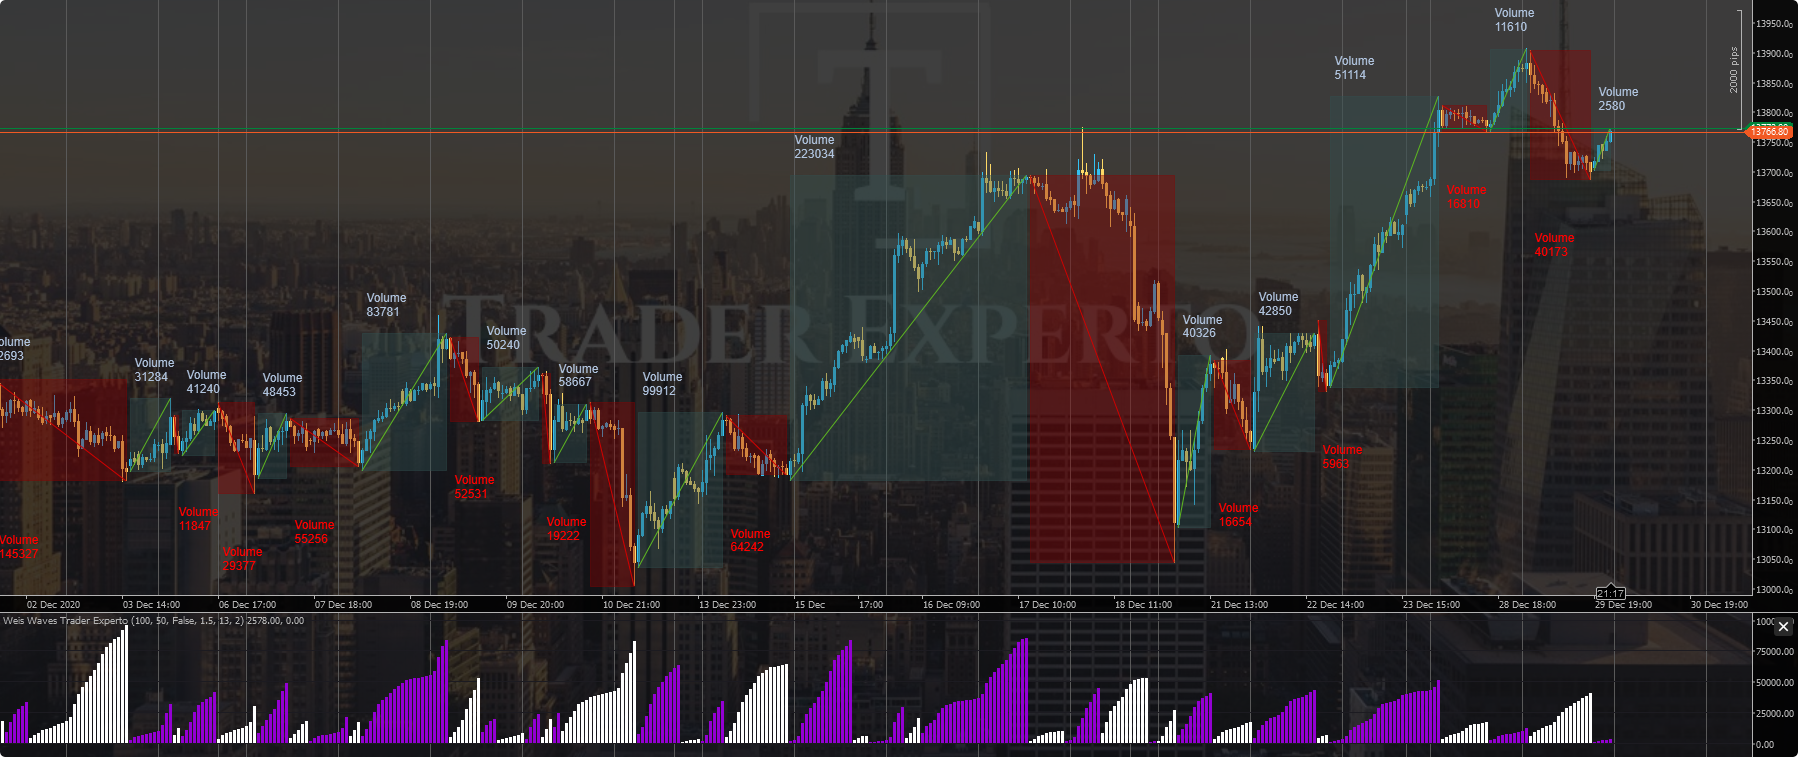
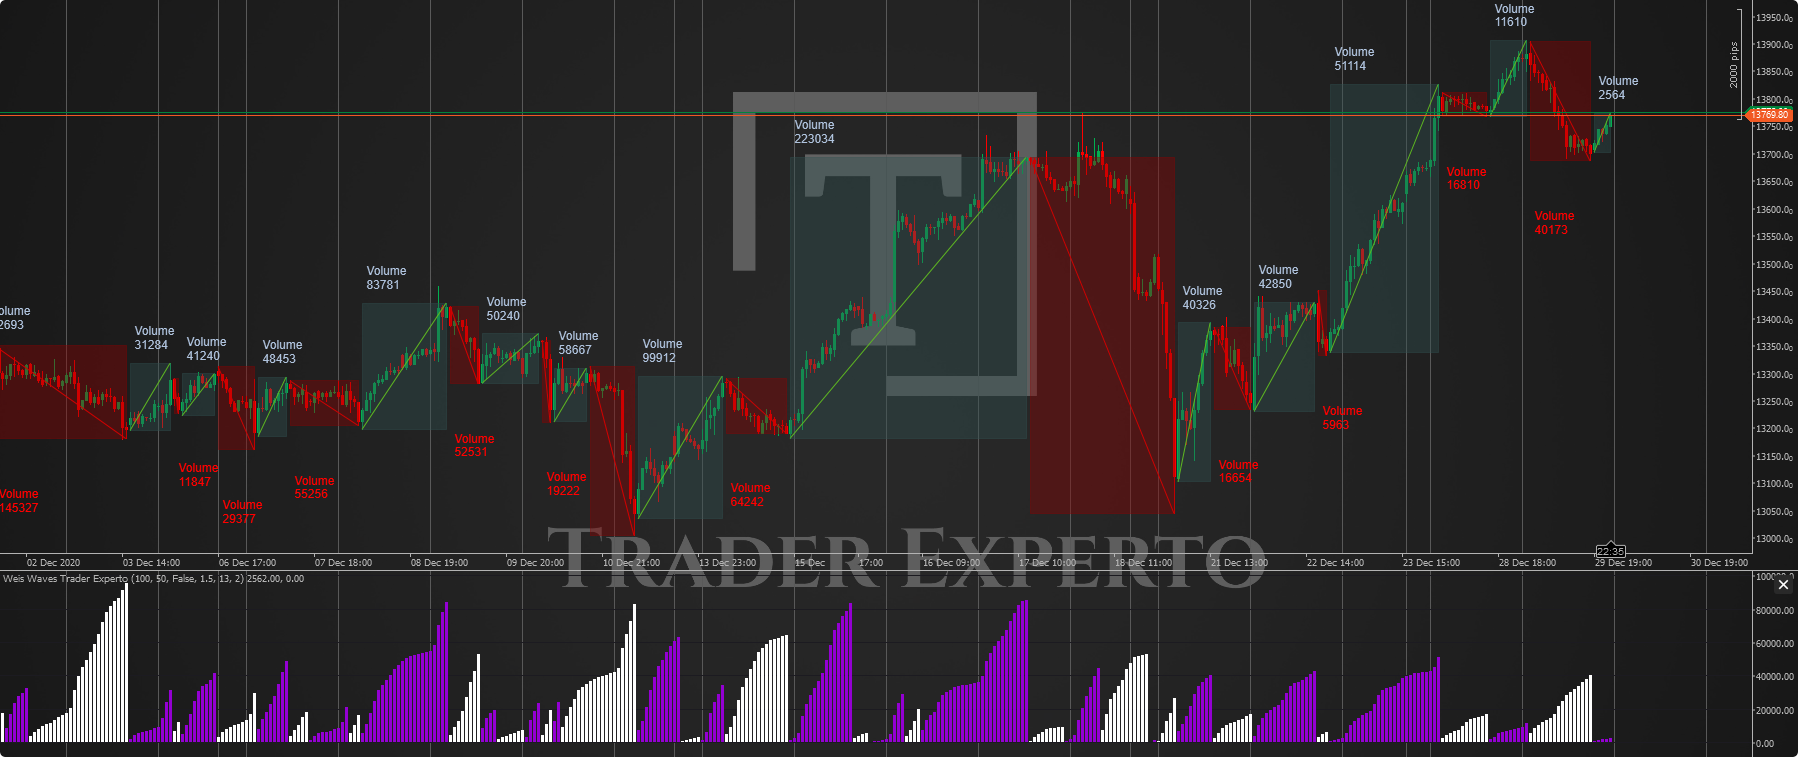
This is a Advanced ZigZag Indicator Known as Swing Gann. The indicator Plots the Cumulated Volume for every Swing and also Plots the Price movement as also the Cumulated Volume Divided by the Price Movement Known as Speed Index thaugh by David Weis Creator of the Weis Wave Indicator.
You can find me by joyining this Telegram Group http://t.me/cTraderCoders
Grupo de Telegram Para Brasileiros, Portugueses e todos aqueles que falam portugues:http://t.me/ComunidadeCtrader
Grupo CTrader en Español para Latinos: http://t.me/ComunidadCtrader
using System;
using cAlgo.API;
using System.Linq;
using cAlgo.API.Internals;
using cAlgo.API.Indicators;
using cAlgo.Indicators;

namespace cAlgo
{
    [Indicator(IsOverlay = true, TimeZone = TimeZones.UTC, AccessRights = AccessRights.None)]
    public class SwingGannExperto : Indicator
    {
        public enum SwingData
        {
            SpeedIndex,
            Volume,
            Price
        }

        public enum Multi
        {
            Pips = 10,
            Unit = 100,
            Tick = 1
        }

        public enum devi
        {
            Price = 1,
            ATR = 2
        }
        [Parameter("Deviation Size in", Group = "Deviation Settings", DefaultValue = Multi.Unit)]
        public Multi Multiplier { get; set; }

        [Parameter("Deviation Value", Group = "Deviation Settings", DefaultValue = 50, MinValue = 1)]
        public int Deviation { get; set; }

        [Parameter("Bull Rectangle", Group = "Objects Settings", DefaultValue = Colors.DarkSlateGray)]
        public Colors BullRect { get; set; }

        [Parameter("Bear Rectangle", Group = "Objects Settings", DefaultValue = Colors.DarkRed)]
        public Colors BearRect { get; set; }

        [Parameter("Bull Trend Line", Group = "Objects Settings", DefaultValue = Colors.DarkSlateGray)]
        public Colors BullLine { get; set; }

        [Parameter("Bear Trend Line", Group = "Objects Settings", DefaultValue = Colors.DarkRed)]
        public Colors BearLine { get; set; }

        [Parameter("Rectangle Opacity", Group = "Objects Settings", DefaultValue = 40)]
        public int RectangleOpacity { get; set; }

        [Parameter("Swing Data", Group = "Swing Information", DefaultValue = SwingData.Price)]
        public SwingData SwingDataInput { get; set; }


        [Parameter("Atr Multiplier", Group = "ATR Settings", DefaultValue = 2, MinValue = 0, MaxValue = 10)]
        public double atrMultiplier { get; set; }

        [Parameter("Atr Period", Group = "ATR Settings", DefaultValue = 13, MinValue = 1)]
        public int atrPeriod { get; set; }

        [Parameter("Deviation Type", Group = "Deviation Settings", DefaultValue = devi.ATR)]
        public devi deviationType { get; set; }


        private int lastHighIndex = 0;
        private int lastLowIndex = 0;
        private double _point;
        private DataSeries CurrentClose;
        private IndicatorDataSeries Direction;
        private IndicatorDataSeries DownBuffer;
        private AverageTrueRange _averageTrueRange;
        private double DeviationAtr;
        private bool deviationPrice = true;
        private double deviationValue;

        public int UpTrendStartIndex;
        public int DownTrendStartIndex;

        public double PixelsInPrice;

        public double TopDistance;

        public double BottomDistance;

        public int PipsMutliplier = 1;

        public Color BullRectColor;

        public Color BearRectColor;


        protected override void Initialize()
        {

            RectangleOpacity = RectangleOpacity > 100 ? 100 : RectangleOpacity < 0 ? 0 : RectangleOpacity;
            RectangleOpacity = (int)(2.55 * RectangleOpacity);

            BullRectColor = Color.FromArgb(RectangleOpacity, Color.FromName(BullRect.ToString()).R, Color.FromName(BullRect.ToString()).G, Color.FromName(BullRect.ToString()).B);

            BearRectColor = Color.FromArgb(RectangleOpacity, Color.FromName(BearRect.ToString()).R, Color.FromName(BearRect.ToString()).G, Color.FromName(BearRect.ToString()).B);


            if (Symbol.Digits == 2 && Symbol.PipSize == 0.1)
            {
                PipsMutliplier = 10;
            }


            PixelsInPrice = (Chart.TopY - Chart.BottomY) / Chart.Height;

            TopDistance = PixelsInPrice * 60;

            Direction = CreateDataSeries();
            CurrentClose = Bars.ClosePrices;
            DownBuffer = CreateDataSeries();
            _point = Symbol.TickSize * (double)Multiplier;
            _averageTrueRange = Indicators.AverageTrueRange(atrPeriod, MovingAverageType.Weighted);
            if (deviationType == devi.ATR)
            {
                _point = 1;
                deviationPrice = false;
            }
            else
            {
                deviationPrice = true;
            }


            //CalculateSwings(1, Chart.FirstVisibleBarIndex, Chart.LastVisibleBarIndex, SwingDataInput, Bars.Count - 1);
        }

        public override void Calculate(int index)
        {
            if (deviationPrice)
            {
                deviationValue = Deviation;
            }
            else
            {
                DeviationAtr = _averageTrueRange.Result[index] * atrMultiplier;
                deviationValue = DeviationAtr;
            }

            int r = 0;

            if (index == 1)
            {
                if (CurrentClose[index] >= Bars.ClosePrices[index - 1])
                {
                    lastHighIndex = index;
                    lastLowIndex = index - 1;
                    Direction[index] = 1;
                    Direction[index - 1] = 1;

                    UpTrendStartIndex = index - 1;

                    Chart.DrawTrendLine("TrendLine" + UpTrendStartIndex, UpTrendStartIndex, Bars.LowPrices[UpTrendStartIndex], index, Bars.HighPrices[index], BullLine.ToString());
                    Chart.DrawRectangle("Rectangle" + UpTrendStartIndex, UpTrendStartIndex, Bars.LowPrices[UpTrendStartIndex], index, Bars.HighPrices[index], BullRectColor).IsFilled = true;
                    CalculateSwings(1, UpTrendStartIndex, index, SwingDataInput, UpTrendStartIndex);
                }
                else if (CurrentClose[index] < Bars.ClosePrices[index - 1])
                {
                    lastLowIndex = index;
                    lastHighIndex = index - 1;
                    Direction[index] = 3;
                    Direction[index - 1] = 3;

                    DownTrendStartIndex = index - 1;

                    Chart.DrawTrendLine("TrendLine" + DownTrendStartIndex, DownTrendStartIndex, Bars.HighPrices[UpTrendStartIndex], index, Bars.LowPrices[index], Color.Red);
                    Chart.DrawRectangle("Rectangle" + DownTrendStartIndex, DownTrendStartIndex, Bars.HighPrices[UpTrendStartIndex], index, Bars.LowPrices[index], BearRectColor).IsFilled = true;
                    CalculateSwings(3, DownTrendStartIndex, index, SwingDataInput, DownTrendStartIndex);
                }
            }


            Direction[index] = Direction[index - 1];

            if (Direction[index] == 1)
            {
                if (Bars.HighPrices[lastHighIndex] - CurrentClose[index] > (deviationValue * _point))
                {
                    Direction[index] = 3;
                }
            }
            else if (Direction[index] == 3)
            {
                if (Bars.ClosePrices[index] - Bars.LowPrices[lastLowIndex] > (deviationValue * _point))
                {
                    Direction[index] = 1;
                }
            }
//***********************************************************************************************************************************//
            if (Direction[index] == 1)
            {
                if (Direction[index - 1] == 1)
                {


                    if (CurrentClose[lastHighIndex] < CurrentClose[index])
                    {
                        lastHighIndex = index;
                    }
                    Chart.DrawTrendLine("TrendLine" + UpTrendStartIndex, UpTrendStartIndex, Bars.LowPrices[UpTrendStartIndex], index, Bars.HighPrices[lastHighIndex], Color.LawnGreen);
                    Chart.DrawRectangle("Rectangle" + UpTrendStartIndex, UpTrendStartIndex, Bars.LowPrices[UpTrendStartIndex], index, Bars.HighPrices[lastHighIndex], BullRectColor).IsFilled = true;
                    CalculateSwings(1, UpTrendStartIndex, lastHighIndex, SwingDataInput, UpTrendStartIndex);
                }
                //**********************************************************	//
                else if (Direction[index - 1] == 3)
                {

                    Chart.DrawTrendLine("TrendLine" + DownTrendStartIndex, DownTrendStartIndex, Bars.HighPrices[DownTrendStartIndex], lastLowIndex, Bars.LowPrices[lastLowIndex], Color.Red);
                    Chart.DrawRectangle("Rectangle" + DownTrendStartIndex, DownTrendStartIndex, Bars.HighPrices[DownTrendStartIndex], lastLowIndex, Bars.LowPrices[lastLowIndex], BearRectColor).IsFilled = true;
                    CalculateSwings(3, DownTrendStartIndex, lastLowIndex, SwingDataInput, DownTrendStartIndex);
                    for (r = (lastLowIndex + 2); r <= index; r++)
                    {

                    }
                    lastHighIndex = index;
                    UpTrendStartIndex = lastLowIndex + 1;

                    Chart.DrawTrendLine("TrendLine" + UpTrendStartIndex, UpTrendStartIndex, Bars.LowPrices[UpTrendStartIndex], index, Bars.HighPrices[index], Color.LawnGreen);
                    Chart.DrawRectangle("Rectangle" + UpTrendStartIndex, UpTrendStartIndex, Bars.LowPrices[UpTrendStartIndex], index, Bars.HighPrices[index], BullRectColor).IsFilled = true;
                    CalculateSwings(1, UpTrendStartIndex, index, SwingDataInput, UpTrendStartIndex);
                }
            }
            else if (Direction[index] == 3)
            {
                if (Direction[index - 1] == 3)
                {

                    if (CurrentClose[index] < CurrentClose[lastLowIndex])
                    {
                        lastLowIndex = index;
                    }
                    Chart.DrawTrendLine("TrendLine" + DownTrendStartIndex, DownTrendStartIndex, Bars.HighPrices[DownTrendStartIndex], index, Bars.LowPrices[lastLowIndex], Color.Red);
                    Chart.DrawRectangle("Rectangle" + DownTrendStartIndex, DownTrendStartIndex, Bars.HighPrices[DownTrendStartIndex], index, Bars.LowPrices[lastLowIndex], BearRectColor).IsFilled = true;
                    CalculateSwings(3, DownTrendStartIndex, lastLowIndex, SwingDataInput, DownTrendStartIndex);
                }
                //**********************************************************	//
                else if (Direction[index - 1] == 1)
                {


                    Chart.DrawTrendLine("TrendLine" + UpTrendStartIndex, UpTrendStartIndex, Bars.LowPrices[UpTrendStartIndex], lastHighIndex, Bars.HighPrices[lastHighIndex], Color.LawnGreen);
                    Chart.DrawRectangle("Rectangle" + UpTrendStartIndex, UpTrendStartIndex, Bars.LowPrices[UpTrendStartIndex], lastHighIndex, Bars.HighPrices[lastHighIndex], BullRectColor).IsFilled = true;
                    CalculateSwings(1, UpTrendStartIndex, lastHighIndex, SwingDataInput, UpTrendStartIndex);
                    //**********************************************************//

                    for (r = (lastHighIndex + 2); r <= index; r++)
                    {

                    }
                    lastLowIndex = index;
                    DownTrendStartIndex = lastHighIndex + 1;
                    Chart.DrawTrendLine("TrendLine" + DownTrendStartIndex, DownTrendStartIndex, Bars.HighPrices[lastHighIndex + 1], index, Bars.LowPrices[index], Color.Red);
                    Chart.DrawRectangle("Rectangle" + DownTrendStartIndex, DownTrendStartIndex, Bars.HighPrices[lastHighIndex + 1], index, Bars.LowPrices[index], BearRectColor).IsFilled = true;
                    CalculateSwings(3, DownTrendStartIndex, index, SwingDataInput, DownTrendStartIndex);
                }

            }

        }
        public void CalculateSwings(int direction, int firstCandle, int lastCandle, SwingData SwingOption, int objectIndex)
        {
            if (SwingOption == SwingData.Price)
            {
                Print("Calculate Price");
                if (direction == 1)
                {
                    var price = Bars.HighPrices[lastCandle] - Bars.LowPrices[firstCandle];
                    price = Math.Round(price, Symbol.Digits);
                    price = (price / Symbol.PipSize) / PipsMutliplier;
                    Chart.DrawText("Text" + objectIndex, "Price \n" + price, objectIndex, Bars.HighPrices[lastCandle] + TopDistance, Color.LightSteelBlue);

                }
                else if (direction == 3)
                {
                    var price = Bars.HighPrices[firstCandle] - Bars.LowPrices[lastCandle];
                    price = Math.Round(price, Symbol.Digits);
                    price = (price / Symbol.PipSize) / PipsMutliplier;
                    Chart.DrawText("Text" + objectIndex, "Price \n" + price, objectIndex, Bars.LowPrices[lastCandle] - TopDistance, Color.Red);

                }
            }
            else if (SwingOption == SwingData.Volume)
            {
                Print("Calculate Volume");
                if (direction == 1)
                {
                    //var price = Bars.HighPrices[lastCandle] - Bars.LowPrices[firstCandle];
                    var volume = 0.0;
                    for (int i = firstCandle; i <= lastCandle; i++)
                    {
                        volume += Bars.TickVolumes[i];
                    }
                    Chart.DrawText("Text" + objectIndex, "Volume \n" + volume, objectIndex, Bars.HighPrices[lastCandle] + TopDistance, Color.LightSteelBlue);

                }
                else if (direction == 3)
                {
                    //var price = Bars.HighPrices[firstCandle] - Bars.LowPrices[lastCandle];
                    var volume = 0.0;
                    for (int i = firstCandle; i <= lastCandle; i++)
                    {
                        volume += Bars.TickVolumes[i];
                    }
                    Chart.DrawText("Text" + objectIndex, "Volume \n" + volume, objectIndex, Bars.LowPrices[lastCandle] - TopDistance, Color.Red);
                }
            }
            else if (SwingOption == SwingData.SpeedIndex)
            {
                Print("Calculate Speed Index");
                if (direction == 1)
                {
                    var price = Bars.HighPrices[lastCandle] - Bars.LowPrices[firstCandle];
                    price = (price / Symbol.PipSize) / PipsMutliplier;
                    var volume = 0.0;
                    var speedIndex = 0.0;
                    for (int i = firstCandle; i <= lastCandle; i++)
                    {
                        volume += Bars.TickVolumes[i];
                    }
                    speedIndex = volume / price;
                    speedIndex = Math.Round(speedIndex, 2);
                    Chart.DrawText("Text" + objectIndex, "Speed \n" + speedIndex, objectIndex, Bars.HighPrices[lastCandle] + TopDistance, Color.LightSteelBlue);

                }
                else if (direction == 3)
                {
                    var price = Bars.HighPrices[firstCandle] - Bars.LowPrices[lastCandle];
                    price = (price / Symbol.PipSize) / PipsMutliplier;
                    var volume = 0.0;
                    var speedIndex = 0.0;
                    for (int i = firstCandle; i <= lastCandle; i++)
                    {
                        volume += Bars.TickVolumes[i];
                    }
                    speedIndex = volume / price;
                    speedIndex = Math.Round(speedIndex, 2);
                    Chart.DrawText("Text" + objectIndex, "Speed \n" + speedIndex, objectIndex, Bars.LowPrices[lastCandle] - TopDistance, Color.Red);

                }
            }

        }
    }
}

TraderExperto
Joined on 07.06.2019
- Distribution: Free
- Language: C#
- Trading platform: cTrader Automate
- File name: Swing Gann Experto .algo
- Rating: 4
- Installs: 4228
- Modified: 13/10/2021 09:54

Comments
cannot be installed .sln file missing
we need fix please
cannot be installed .sln file missing
we need fix please
Hi there is some kind of .sln file is missing. Can you please fix it. Thanks.
@TraderExperto - i take my hat off to you. You Italians amaze me!!!
To code this indicator is not easy but you managed to achieve this in style !!!
@indrakh - Use H4
You still need to combine this indi with others.
It is good for trading Micro-trends(H4 & below).
If you are trading Macro trends (D3 - WK1) then this indi should be used for gauging your entry (and remember, you still need the help of other indi's)
Hi @tradeexperto,
What is the best time frame, do you suggest to trade with this indy?.
Many thanks in advance.
Best Regards.
redraws everything on refresh. Makes cTrader lag