Description
This is a Volatility Indicator for cTrader.
Candlestick charts, Renko charts, and Range charts allow us to understand the price movements, but they do not give us an idea of the price activity, or the number of ticks. Also, while tick charts allow us to know the price movement within a certain number of ticks, it is difficult to visually understand the changes of the period of time it takes to form a bar. This indicator shows these hard-to-acquire information in a variety of resolutions.
Example of use----------------------------
・Analysis of Candlestick Chart by Candlestick Chart
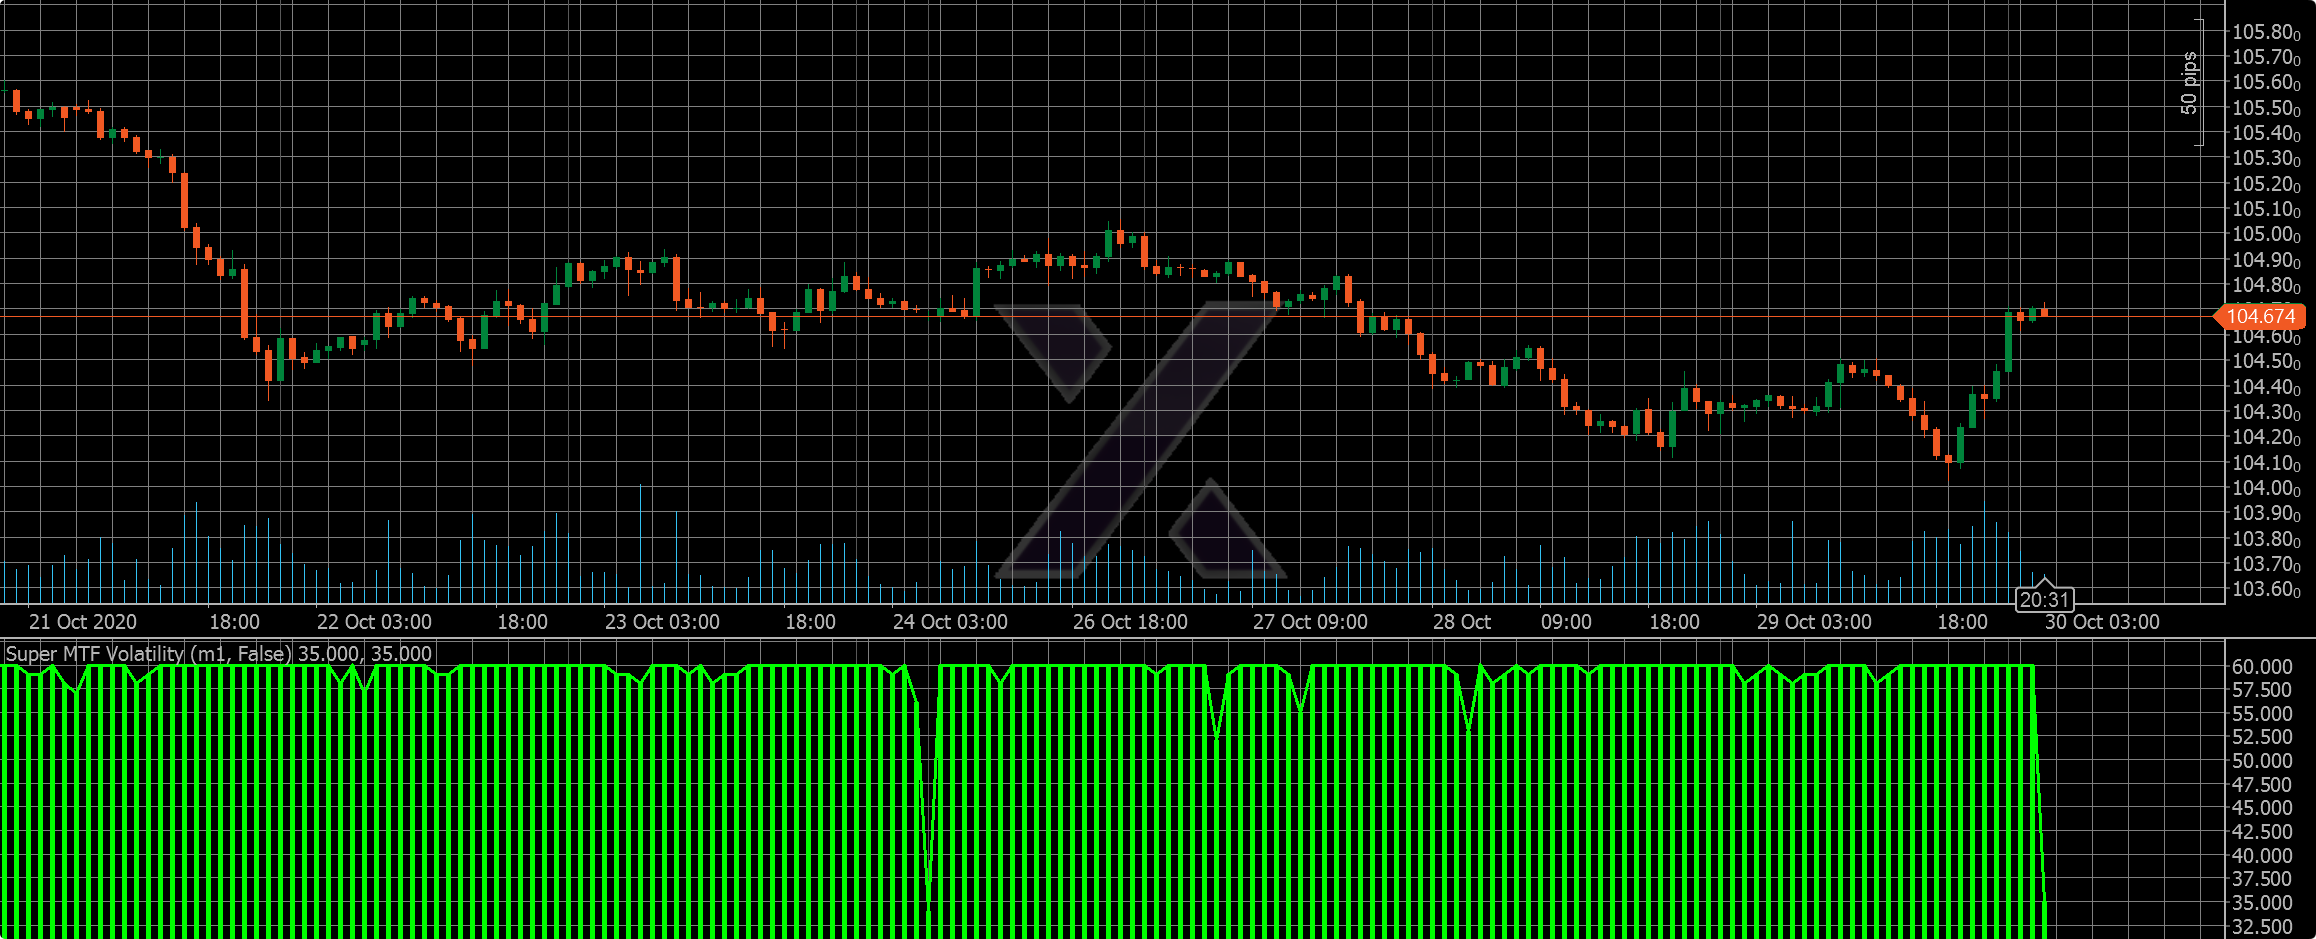
The H1 chart shows price movements within an hour, but the period of time it takes to form a single bar is not necessarily exactly an hour. This is due to the fact that the start and end time of the trade by the broker is not actually the beginning of the hour. This makes it impossible to actually get a fair understanding of price movements. This indicator allows you to get the actual time taken to form a bar at various finer resolutions (M1, M5, M10, M15, etc.). Of course, the analysis is available in any timeframe charts.
・Analysis of Candlestick Chart by Tick Chart
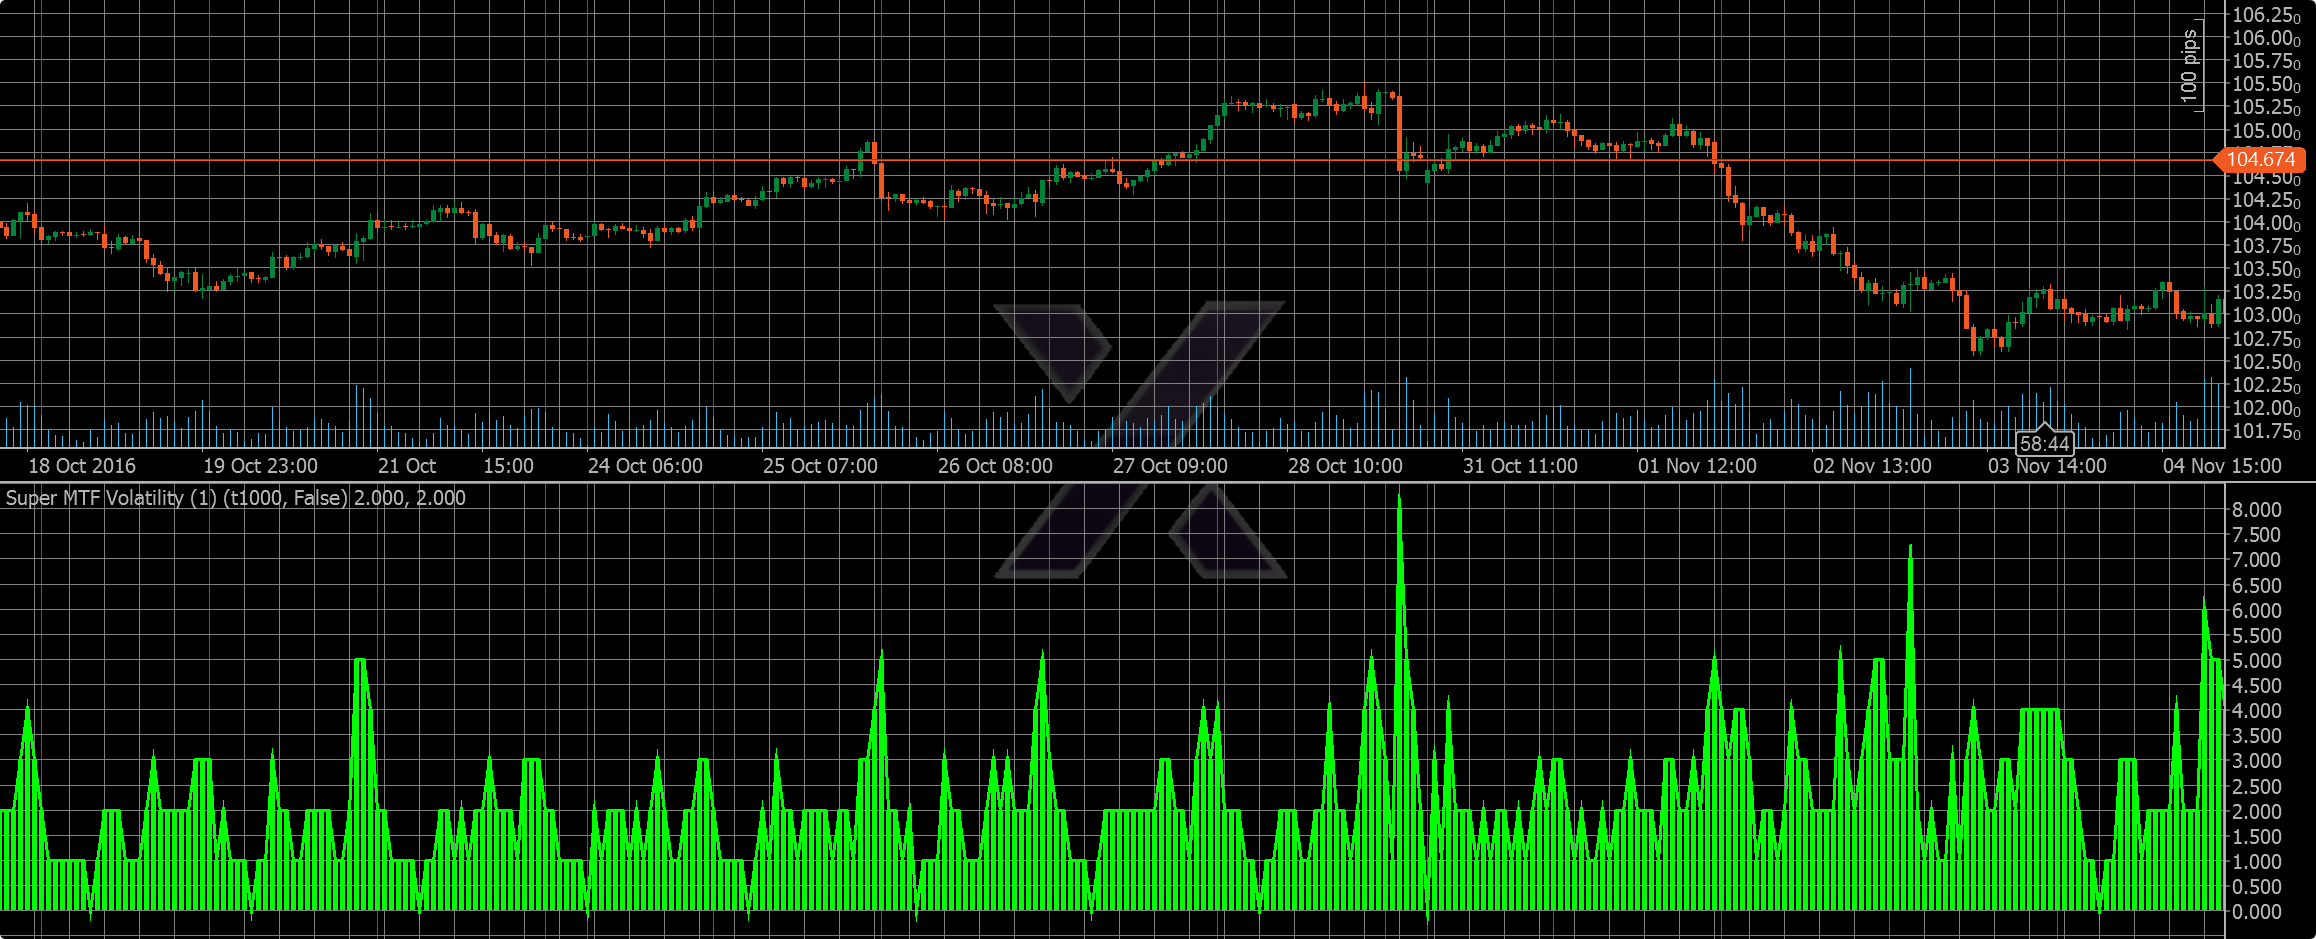
Candlesticks give us an idea of price movements within a period of time, but it is difficult to visually capture trading activity, or the number of ticks. This indicator allows you to see how many ticks the price has moved in a period of time at various resolutions (t100, t500, t1000, etc.).
・Analysis of Renko or Range Chart
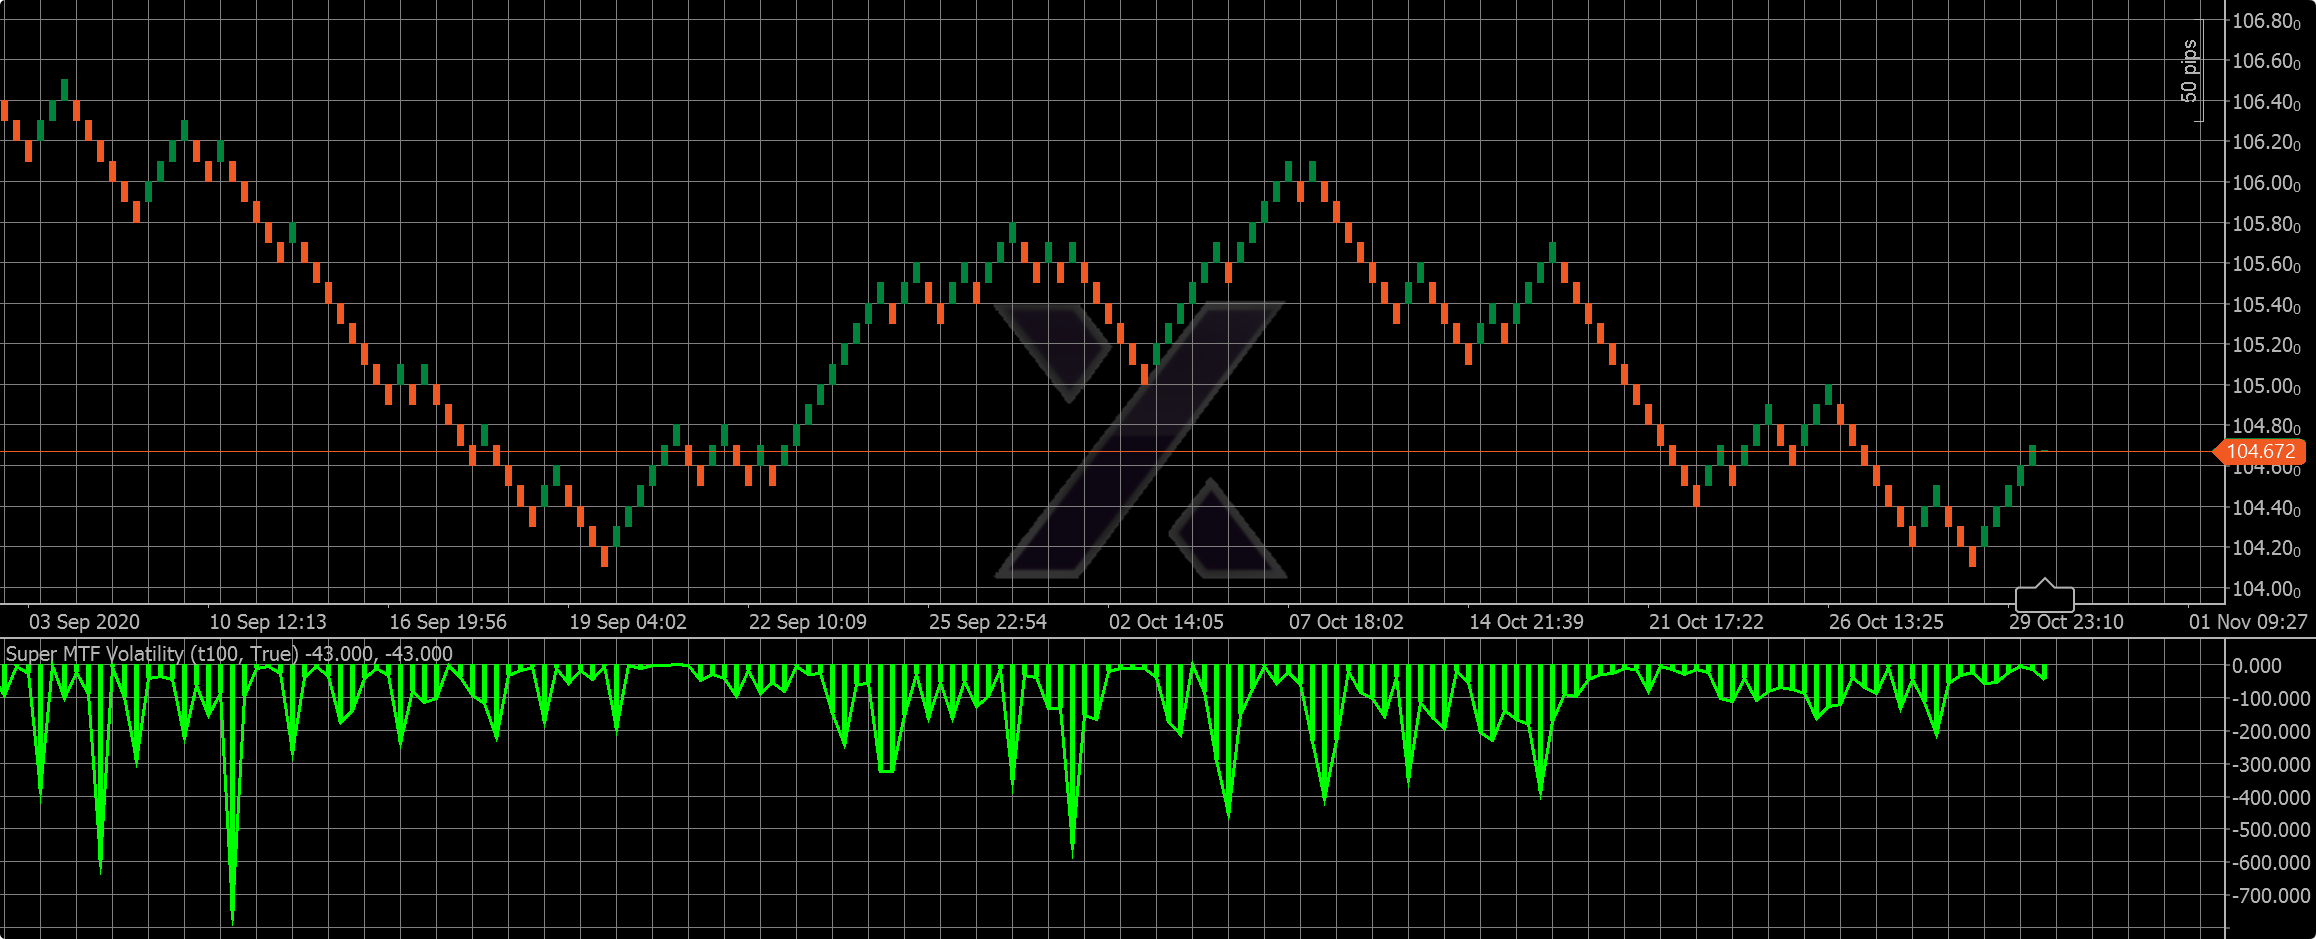
On the Renko and Range charts, the bar is fixed at every fixed price movement. While this makes it easy to capture price movements, the time it takes to form a bar and the number of ticks it takes to form a bar varies greatly from bar to bar, making it very difficult to capture these volatilities visually. This indicator displays this information (how long or how many ticks it takes to form a bar) in a variety of resolutions (M1, M5, M10, t100, t500, t1000, etc.).
-----------------------------------------------------
Notice
・Due to the complexities involved in calculating this indicator, it takes a while for the indicator to appear.
・A resolution rougher than t100 is recommended for tick-based analysis in order to make the calculations run smoothly.
・It does not guarantee any particular outcome or profit of any kind. Please enjoy trading at your own risk.
--------------------------------------------------
Please download from here
We can also take orders for algorithm development.
Please feel free to contact us.
© 2020, Taro Yamada, taro.yamada.forex@gmail.com
using System;
using cAlgo.API;
using cAlgo.API.Internals;
using cAlgo.API.Indicators;
using cAlgo.Indicators;

namespace cAlgo
{
    [Indicator(IsOverlay = false, TimeZone = TimeZones.UTC, AccessRights = AccessRights.None)]
    public class SMVLink : Indicator
    {
        protected override void Initialize()
        {
            ChartObjects.DrawText("SMVLink Link", "Download : https://gum.co/WZohBQ", StaticPosition.Center, Colors.Red);
        }

        public override void Calculate(int index)
        {
            // Calculate value at specified index
            // Result[index] = ...
        }
    }
}
akamanbow3
Joined on 17.09.2020
- Distribution: Paid
- Language: C#
- Trading platform: cTrader Automate
- File name: SMVLink.algo
- Rating: 0
- Installs: 973
- Modified: 13/10/2021 09:54
