Description
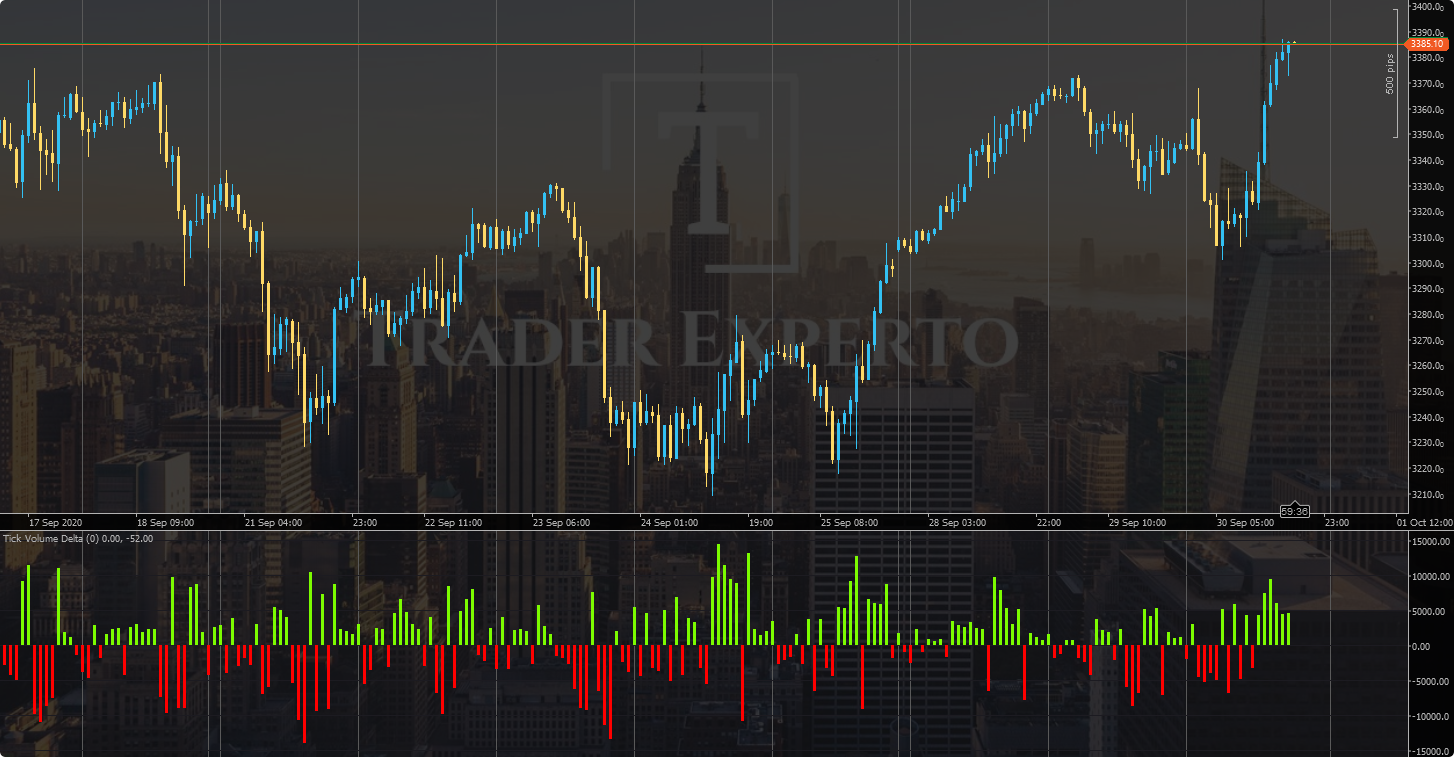
This is a Simple Tick Volume in a Delta visualization. It simply shows the Selling Volume as negative given a better Visualization between Buying and Selling Volume.
Para os que querem participar de um Grupo dedicado ao CTrader no Telegram para falar sobre estratégias, desenvolvimento de indicadores na Plataforma e muito mais. Aqui segue o link
Grupo CTrader em Portugues -->> https://t.me/ComunidadeCtrader
Grupo CTrader en Español -->> http://t.me/ComunidadCtrader
using System;
using cAlgo.API;
using cAlgo.API.Internals;
using cAlgo.API.Indicators;
using cAlgo.Indicators;

namespace cAlgo
{
    [Indicator(IsOverlay = false, TimeZone = TimeZones.UTC, AccessRights = AccessRights.None)]
    public class TickVolumeDelta : Indicator
    {
        [Parameter(DefaultValue = 0.0)]
        public double Parameter { get; set; }

        [Output("Up Volume", LineColor = "LawnGreen", PlotType = PlotType.Histogram, Thickness = 3)]
        public IndicatorDataSeries UpVolume { get; set; }

        [Output("Down Volume", LineColor = "Red", PlotType = PlotType.Histogram, Thickness = 3)]
        public IndicatorDataSeries DownVolume { get; set; }

        protected override void Initialize()
        {
            // Initialize and create nested indicators
        }

        public override void Calculate(int index)
        {
            if (Bars.ClosePrices[index] >= Bars.OpenPrices[index])
            {
                UpVolume[index] = Bars.TickVolumes[index];
                DownVolume[index] = 0.0;
            }
            else if (Bars.ClosePrices[index] < Bars.OpenPrices[index])
            {
                DownVolume[index] = Bars.TickVolumes[index] * -1;
                UpVolume[index] = 0.0;
            }
        }
    }
}

TraderExperto
Joined on 07.06.2019
- Distribution: Free
- Language: C#
- Trading platform: cTrader Automate
- File name: Tick Volume Delta.algo
- Rating: 5
- Installs: 3045
- Modified: 13/10/2021 09:54

Comments
I'll be uploading more stuff soon, including a 1001 games Weis Wave, a Weis Box, an Anchored VWAP, a Volume Profile, and a Range Volume Profile. If you want to chat with me, you can find me in the Telegram Group Ctrader Comunity as Trader Experto or Renato Cavalcante.
I appreciate your effort. But this is actually a kind of volume of the ticks and not the actual volume of the contracts that have been traded. The cTrader has 'tick volume' or simply put 'number of ticks'. One can take a position with 10 contracts at a given price. Another can take 0.1 position on the same price. In reality it means 10.1 volume contracts at that particular price. But cTrader sees that as a single tick, because all the contracts were at the same price. If the first person with 10 contracts on price x had taken position and second person 0.1 contract on price x+1 had taken position. Then the tick volume on first price (of 10 contracts) was 1 and tick volume on second price (of 0.1 contract) was also 1.
Because tick is a price change and has nothing to do with number of contracts at a specific price. Because cTrader only has the number of ticks and no volume of contracts, this indicator or any other that does anything with volume is misleading.
Sorry for the late Response. I will be soon uploading more stuff like Weis Wave, Weis Box, Anchored VWAP, Volume Profile and a Range Volume Profile. You can find me in the Telegram Group Ctrader Comunity by my name as Trader Experto or Renato Cavalcante if you want to chat with me.
Hi,
seems like you r the first guy interest in tick flow here.
Could u perhaps make:
- zigzag on close showing for each swing tick delta (uptick-downtick), volume, pips, time, cumulative tick delta, cumulative volume. Alerts for divergence via comparing up swings with up swings and vice versa.
- tick delta per bar (highlighting delta divergence on bars)
- cumulative tick delta overlayed on bars (reset each day or possibility to set up start, end point)
- VSA on bars, much better than histogram.
- inside, outside, breakout colouring of bars. Feature to turn on/off
- delta tick market profile, from right to left for certain time windows per day and also composite one attached near y axis for weak, month.
How do I contact you for further discussion?
I understand your point, but this is more of a measure of the number of ticks than the actual number of contracts traded. In cTrader, this is called "tick volume" or simply "number of ticks." For example, if you take a position with 10 contracts at a given price, cTrader will show that volume as 10.1.