Description
Version: 1.0.1 - 24 April 2020
You can find this project on GitHub: https://github.com/Obiriec/A3-Cicli-Hosoda-with-tollerance-lines
// ------------------------------------------------------------
//
// A3 Cicli Hosoda with tollerance lines
// Versione 1.0.0 del 30/03/2020
//
// Autore: Armando Brecciaroli (email: a.brecciaroli@me.com - Telegram: https://t.me/Obiriec)
//
// Questo deve essere usato su Daily TF!
//
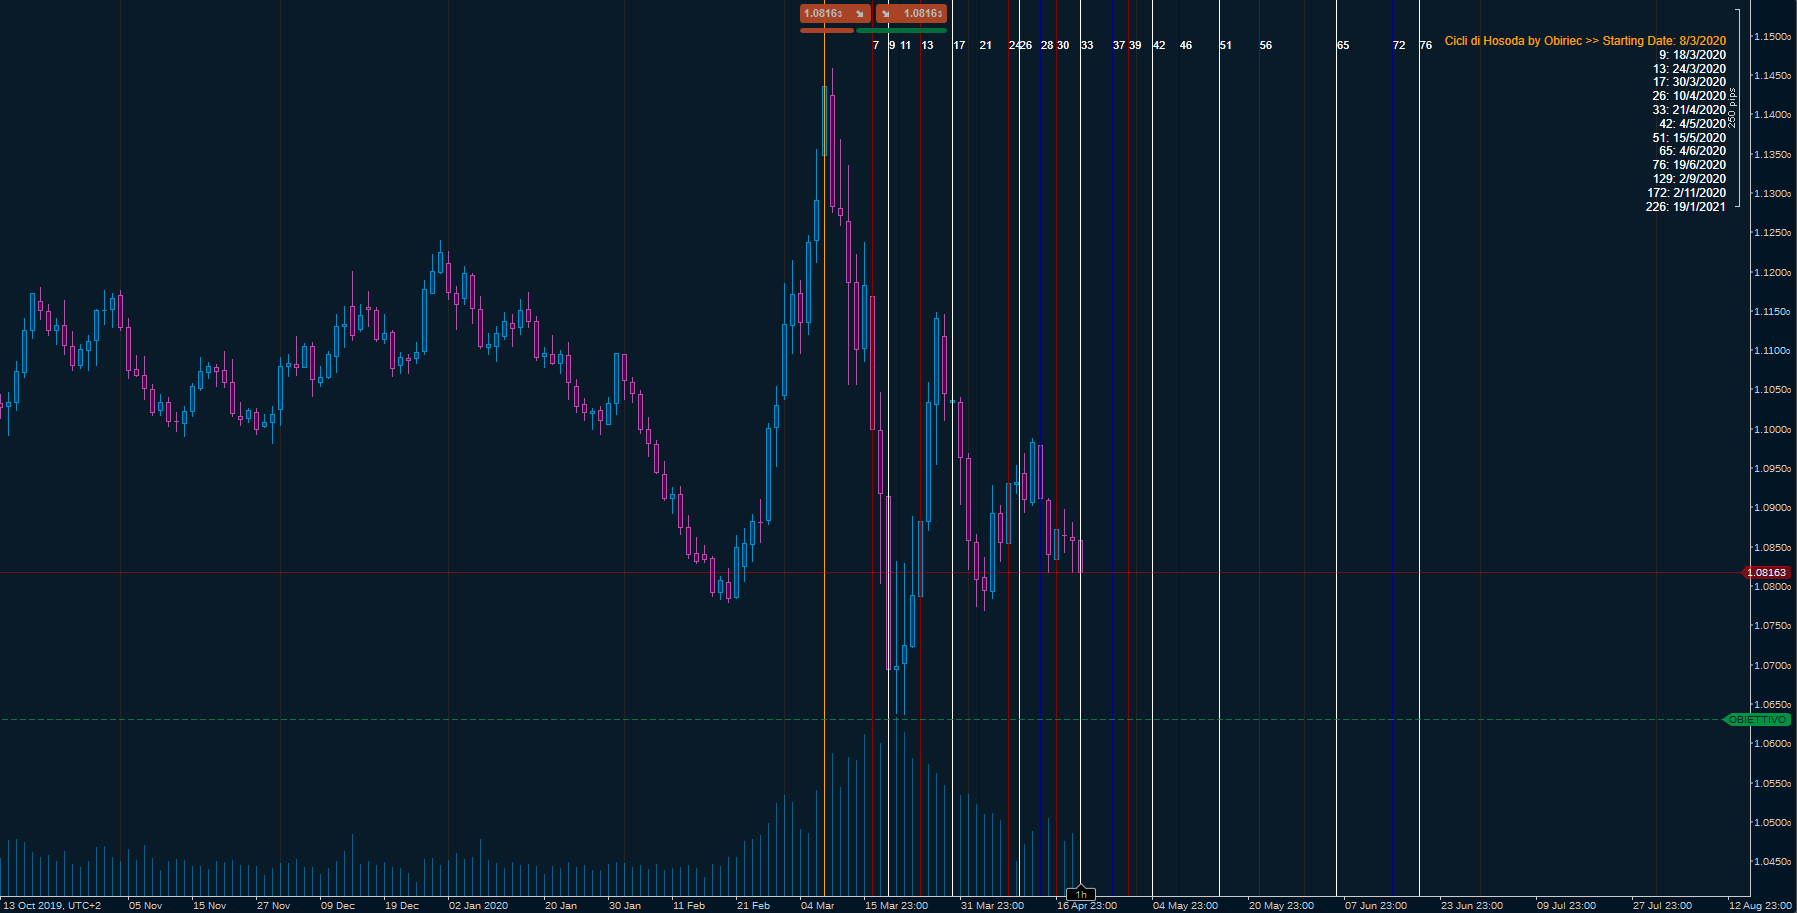
// Questo indicatore mostra i giorni ciclici di Hosoda:
// - la linea grigia è indicato il giorno calcolato
// - la linea rossa indica il giorno di minore tolleranza
// - la linea blu il giorno di maggiore tolleranza.
//
// Premere ctrl e spostare il mouse per impostare la data di inizio (linea arancione).
//
// Mercato: timeframe Daily
// Coppie: Tutte
//
// Changelog:
// v.1.0.1 (Aprile 24, 2020) Cambiati i colori e aggiunta intestazione
//
//------------------------------------------------------------
//
// A3 Hosoda cycles with tolerance lines
// Version 1.0.0 of 30/03/2020
//
// Author: Armando Brecciaroli (email: a.brecciaroli@me.com - Telegram: https://t.me/Obiriec)
//
// This is to be used on Daily TF!
//
// This indicator shows the cyclical days of Hosoda:
// - the Gray line indicates the calculated day
// - the red line indicates the day of least tolerance
// - the blue line on the day of greatest tolerance.
//
// Press ctrl and move the mouse to set the start date (orange line).
//
// Market: Daily timeframe
// Couples: All
//
// Changelog:
// v.1.0.1 (Aprile 24, 2020) Changed colors and added header
//
//------------------------------------------------------------
// ------------------------------------------------------------
//
// A3 Cicli Hosoda with tollerance lines
// Versione 1.0.0 del 30/03/2020
// Autore : Armando Brecciaroli (email: a.brecciaroli@me.com - Telegram: https://t.me/Obiriec)
//
// Questo deve essere usato su Daily TF!
//
// Questo indicatore mostra i giorni ciclici di Hosoda:
// - la linea bianca è indicato il giorno calcolato
// - la linea rossa indica il giorno di minore tolleranza
// - la linea blu il giorno di maggiore tolleranza.
//
// Premere ctrl e spostare il mouse per impostare la data di inizio (linea arancione).
//
// Mercato: timeframe Daily
// Coppie: Tutte
//
//------------------------------------------------------------
//
// A3 Hosoda cycles with tolerance lines
// Version 1.0.0 of 30/03/2020
//
// Author: Armando Brecciaroli (email: a.brecciaroli@me.com - Telegram: https://t.me/Obiriec)
//
// This is to be used on Daily TF!
//
// This indicator shows the cyclical days of Hosoda:
// - the white line indicates the calculated day
// - the red line indicates the day of least tolerance
// - the blue line on the day of greatest tolerance.
//
// Press ctrl and move the mouse to set the start date (orange line).
//
// Market: Daily timeframe
// Couples: All
//
//------------------------------------------------------------
using System;
using cAlgo.API;
using cAlgo.API.Internals;
using cAlgo.API.Indicators;
using cAlgo.Indicators;
using System.Collections.Generic;
namespace cAlgo
{
[Indicator(IsOverlay = true, TimeZone = TimeZones.UTC, AccessRights = AccessRights.None)]
public class A3CicliHosodawithtollerancelines : Indicator
{
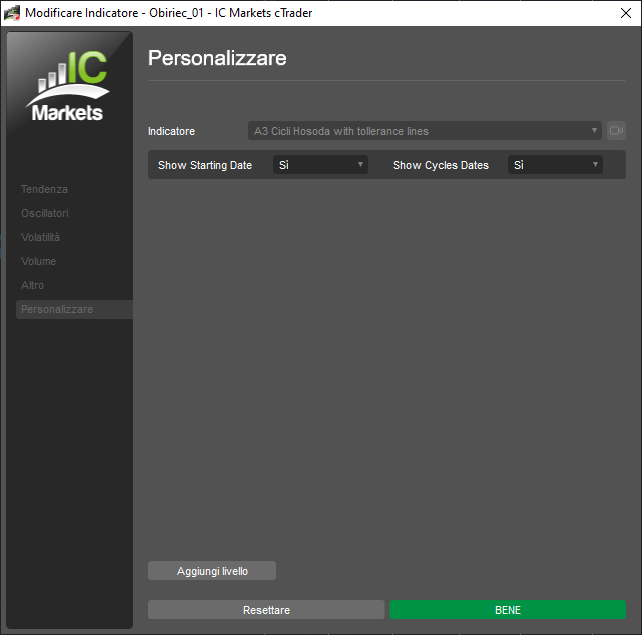
[Parameter("Show Starting Date", DefaultValue = true)]
public bool st_date { get; set; }
[Parameter("Show Cycles Dates", DefaultValue = true)]
public bool cy_date { get; set; }
public DateTime dt;
public int init_index;
public bool error = false;
public string calendar = "";
public string tolleranze = "";
protected override void Initialize()
{
if (MarketSeries.TimeFrame != TimeFrame.Daily)
{
ChartObjects.DrawText("Error", "\n>>> Il TimeFrame deve essere Daily <<<", StaticPosition.TopCenter, Colors.Pink);
error = true;
Print("error 4");
}
Chart.MouseMove += OnChartMouseMove;
}
void OnChartMouseMove(ChartMouseEventArgs obj)
{
if (obj.CtrlKey && !obj.AltKey && !obj.ShiftKey)
{
dt = MarketSeries.OpenTime[(int)obj.BarIndex];
init_index = (int)obj.BarIndex;
Calculate_();
}
}
public int paragone = 0;
public override void Calculate(int index)
{
}
public void Calculate_()
{
if (error)
return;
if (st_date)
ChartObjects.DrawText("start date", "Cicli di Hosoda by Obiriec >> Starting Date: " + dt.Day.ToString() + "/" + dt.Month.ToString() + "/" + dt.Year.ToString(), StaticPosition.TopRight, Colors.Orange);
int count = 1;
int count2 = 1;
double quote = MarketSeries.High[init_index];
ChartObjects.DrawVerticalLine("cycle" + count, dt, Colors.Orange, 1, LineStyle.Solid);
int added_days = 1;
int paragone = count;
int paragone2 = count2;
while (added_days < 365)
{
if (dt.AddDays(added_days).DayOfWeek != DayOfWeek.Sunday && dt.AddDays(added_days).DayOfWeek != DayOfWeek.Saturday && !(dt.AddDays(added_days).Day == 25 && dt.AddDays(added_days).Month == 12) && !(dt.AddDays(added_days).Day == 1 && dt.AddDays(added_days).Month == 1))
count++;
DrawLine(count, dt.AddDays(added_days), quote);
added_days++;
}
if (cy_date)
{
ChartObjects.DrawText("calendar", calendar, StaticPosition.TopRight, Colors.White);
calendar = "";
}
}
public List<int> Days = new List<int>
{
9,
13,
17,
26,
33,
42,
51,
65,
76,
129,
172,
226
};
public List<int> Days_min = new List<int>
{
7,
13,
24,
30,
39,
56,
120,
163,
200
};
public List<int> Days_max = new List<int>
{
11,
21,
28,
37,
46,
72,
138,
179,
257
};
private void DrawLine(int count, DateTime i, double quote)
{
if (count == paragone)
return;
bool checker = false;
bool checker2 = false;
bool checker3 = false;
foreach (int day in Days)
foreach (int day_min in Days_min)
foreach (int day_max in Days_max)
{
if (count == day)
checker = true;
if (count == day_min)
checker2 = true;
if (count == day_max)
checker3 = true;
}
if (checker)
{
Chart.DrawVerticalLine(count.ToString() + " day", i, Color.White);
Chart.DrawText(count.ToString(), count.ToString(), i, quote, Color.White);
calendar = calendar + ("\n" + count.ToString() + ": " + i.Day.ToString() + '/' + i.Month.ToString() + '/' + i.Year.ToString());
paragone = count;
}
if (checker2)
{
Chart.DrawVerticalLine(count.ToString() + " day_min", i, Color.DarkRed);
Chart.DrawText(count.ToString(), count.ToString(), i, quote, Color.White);
paragone = count;
}
if (checker3)
{
Chart.DrawVerticalLine(count.ToString() + " day_max", i, Color.DarkBlue);
Chart.DrawText(count.ToString(), count.ToString(), i, quote, Color.White);
paragone = count;
}
}
}
}
Obiriec
Joined on 08.03.2019
- Distribution: Free
- Language: C#
- Trading platform: cTrader Automate
- File name: A3 Cicli Hosoda with tollerance lines.algo
- Rating: 0
- Installs: 1656
- Modified: 13/10/2021 09:54
