Description
I present to you my intraday POI indicator
it will give you a macro view on lower timeframes
Perfect for Scalping and Daytrading
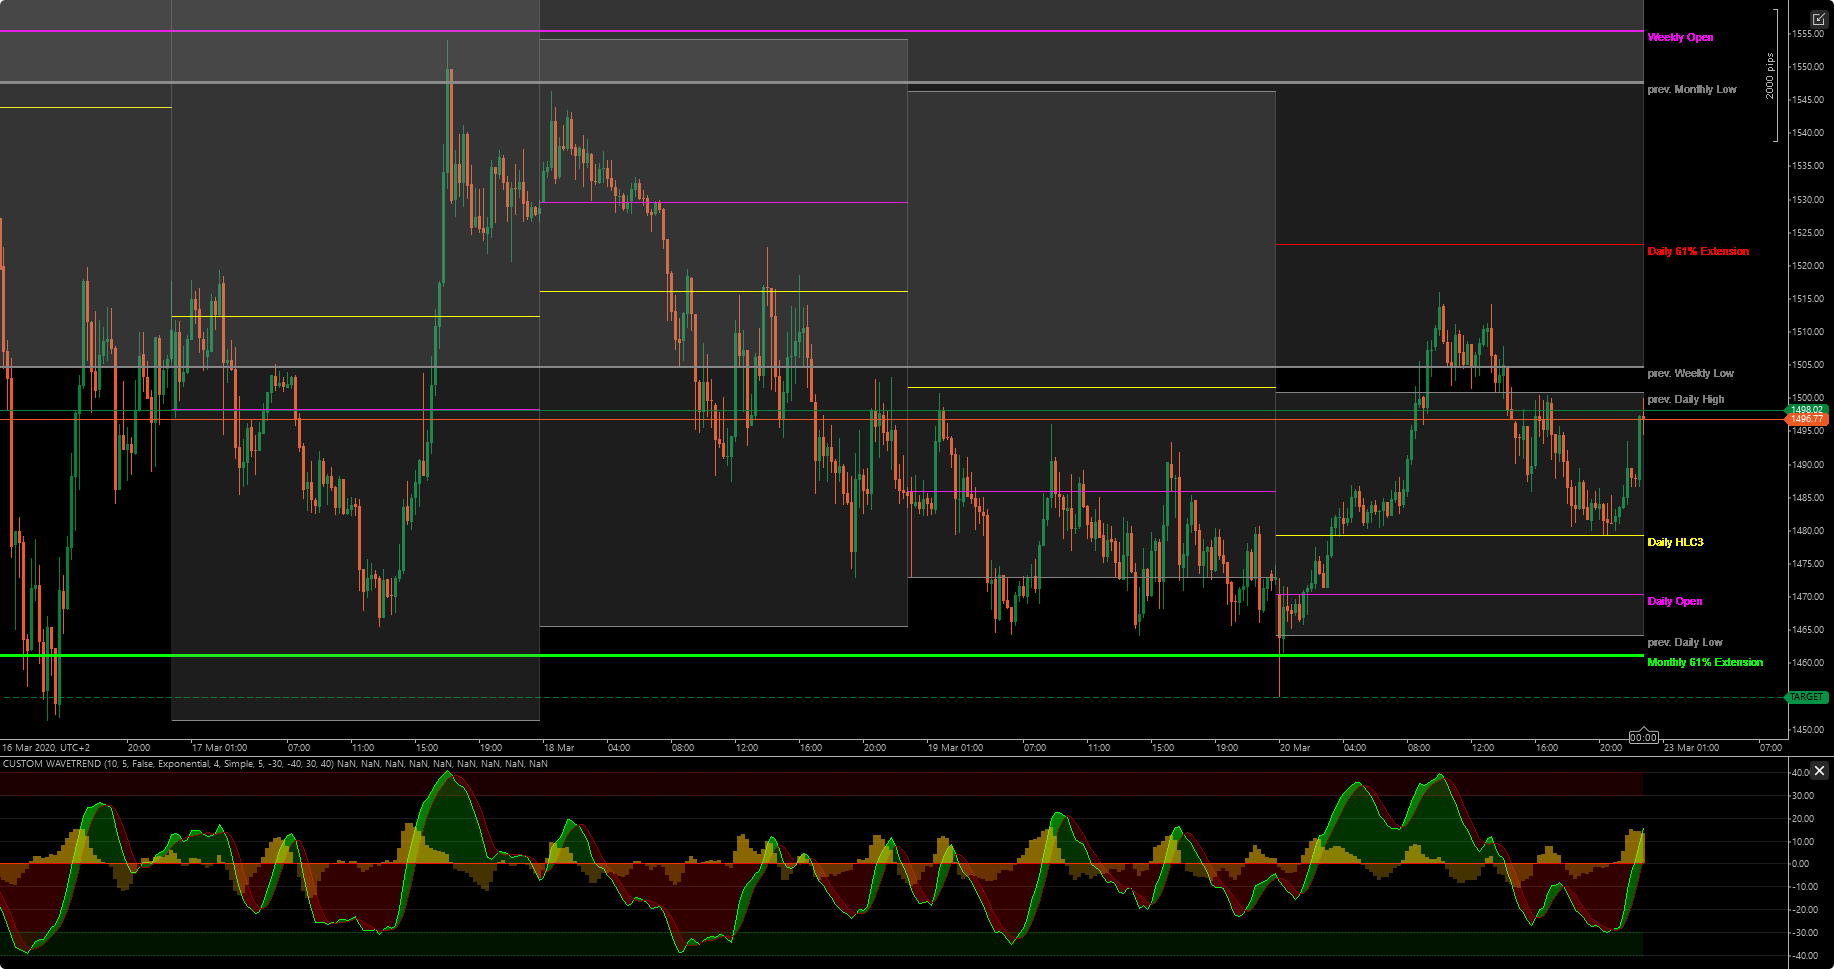
15 min (click for preview)
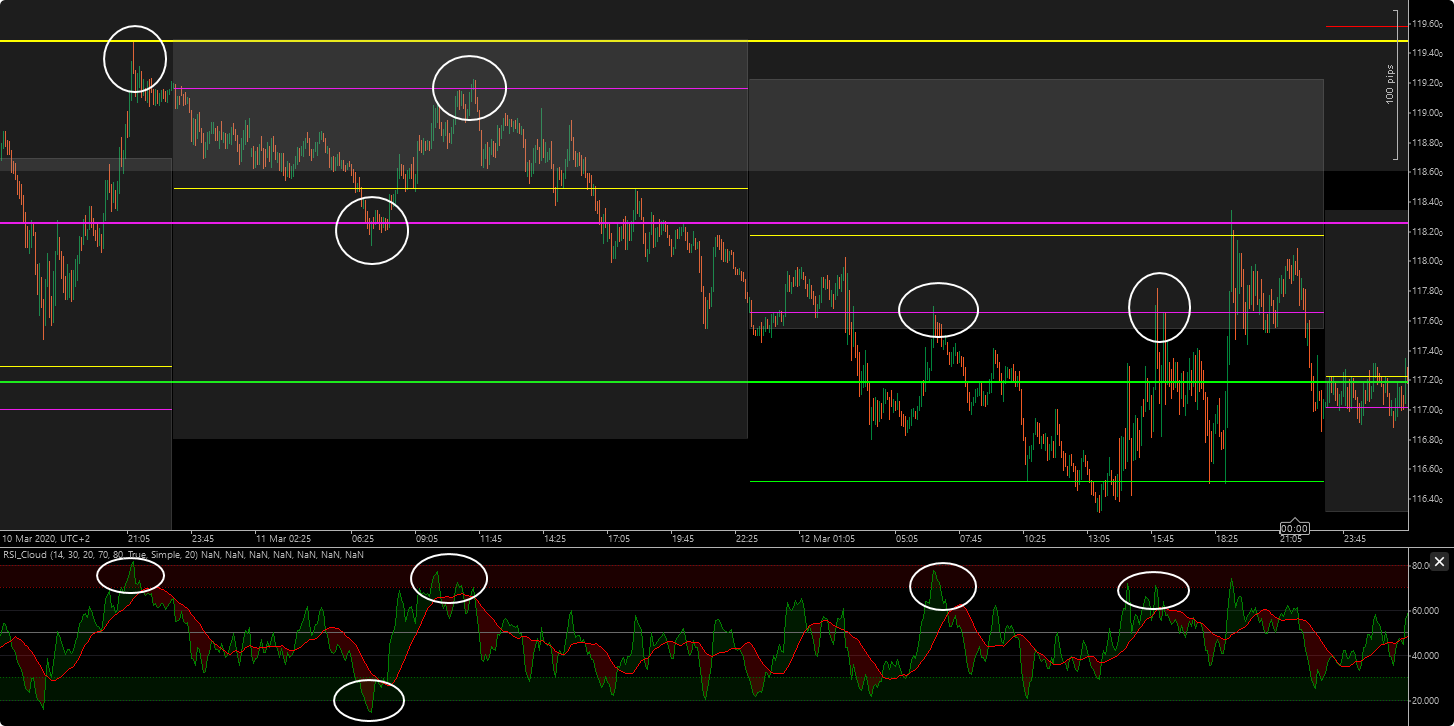
5 min (click for preview)
Options:
- 3 different (customizable) Timeframes with:
- previous high and low lines(option to fill them)
- previous close line
- current open line
- HLC3 (pivot) line
- 61% extension lines (often used as TP)
You can also set the min and max resolution on wich they will show up.
ALL options and timeframes can be turned on/off separately.
NONE of the lines is selectable on chart!
- Not working on 1min chart
- Don't set any Timeframe to < 1H
Suggestions on how to trade
Watch out how price reacts at these levels
- price above the open/hlc3 line -> consider going long, if below -> consider going short
- price hits a line and RSI is OB/OS, it tends to reject
- price above the HL-Band, its considered overbought. price below is considered oversold
Changelog
- 20.03.2020 (Version 1.1)
- added color customisation
- added optional Labels
- 22.03.2020 (Version 1.2)
- added logic to prevent setting any Timeframe to < 1H
- added logic to prevent showing lines on chart if ChartTF = IndicatorTF
- 23.03.2020 (Version 1.3)
- finally fixed the Labels
- set my optimized settings as default (6h,Daily,Weekly)
If you like my work, feel free to spend me a Corona Beer :-)
![]()
using System;
using cAlgo.API;
using cAlgo.API.Indicators;

namespace cAlgo.Indicators
{
    [Indicator(IsOverlay = true, AccessRights = AccessRights.None)]
    public class IntradayPOI : Indicator
    {

        //////////////////////////////////////////////////////////////////////// TF1 PARAMETERS
        [Parameter("Show", Group = "TF1", DefaultValue = true)]
        public bool tf1_show { get; set; }
        [Parameter("Timeframe", Group = "TF1", DefaultValue = "Hour6")]
        public TimeFrame tf1 { get; set; }
        [Parameter("TF1 Line thickness", Group = "TF1", DefaultValue = 1, MinValue = 1, MaxValue = 5)]
        public int tf1_thickness { get; set; }
        [Parameter("min. tf (minutes)", Group = "TF1", DefaultValue = 3, MinValue = 3)]
        public int tf1_mintf { get; set; }
        [Parameter("max. tf (minutes)", Group = "TF1", DefaultValue = 120)]
        public int tf1_maxtf { get; set; }
        [Parameter("Show previous HL", Group = "TF1", DefaultValue = true)]
        public bool tf1_show_hl { get; set; }
        [Parameter("Fill previous HL", Group = "TF1", DefaultValue = true)]
        public bool tf1_show_hlfill { get; set; }
        [Parameter("Show Close Levels", Group = "TF1", DefaultValue = false)]
        public bool tf1_show_close { get; set; }
        [Parameter("Show Open Levels", Group = "TF1", DefaultValue = true)]
        public bool tf1_show_open { get; set; }
        [Parameter("Show HLC3 (Pivot) Levels", Group = "TF1", DefaultValue = true)]
        public bool tf1_show_hlc3 { get; set; }
        [Parameter("Show 61% Extensions", Group = "TF1", DefaultValue = false)]
        public bool tf1_show_extensions { get; set; }

        //////////////////////////////////////////////////////////////////////// TF2 PARAMETERS
        [Parameter("Show", Group = "TF2", DefaultValue = true)]
        public bool tf2_show { get; set; }
        [Parameter("Timeframe", Group = "TF2", DefaultValue = "Daily")]
        public TimeFrame tf2 { get; set; }
        [Parameter("TF2 Line thickness", Group = "TF2", DefaultValue = 2, MinValue = 1, MaxValue = 5)]
        public int tf2_thickness { get; set; }
        [Parameter("min. tf (minutes)", Group = "TF2", DefaultValue = 3, MinValue = 3)]
        public int tf2_mintf { get; set; }
        [Parameter("max. tf (minutes)", Group = "TF2", DefaultValue = 480)]
        public int tf2_maxtf { get; set; }
        [Parameter("Show previous HL", Group = "TF2", DefaultValue = true)]
        public bool tf2_show_hl { get; set; }
        [Parameter("Fill previous HL", Group = "TF2", DefaultValue = false)]
        public bool tf2_show_hlfill { get; set; }
        [Parameter("Show Close Levels", Group = "TF2", DefaultValue = false)]
        public bool tf2_show_close { get; set; }
        [Parameter("Show Open Levels", Group = "TF2", DefaultValue = true)]
        public bool tf2_show_open { get; set; }
        [Parameter("Show HLC3 (Pivot) Levels", Group = "TF2", DefaultValue = true)]
        public bool tf2_show_hlc3 { get; set; }
        [Parameter("Show 61% Extensions", Group = "TF2", DefaultValue = false)]
        public bool tf2_show_extensions { get; set; }

        //////////////////////////////////////////////////////////////////////// TF3 PARAMETERS
        [Parameter("Show", Group = "TF3", DefaultValue = true)]
        public bool tf3_show { get; set; }
        [Parameter("Timeframe", Group = "TF3", DefaultValue = "Weekly")]
        public TimeFrame tf3 { get; set; }
        [Parameter("TF3 Line thickness", Group = "TF3", DefaultValue = 3, MinValue = 1, MaxValue = 5)]
        public int tf3_thickness { get; set; }
        [Parameter("min. tf (minutes)", Group = "TF3", DefaultValue = 15, MinValue = 3)]
        public int tf3_mintf { get; set; }
        [Parameter("max. tf (minutes)", Group = "TF3", DefaultValue = 920)]
        public int tf3_maxtf { get; set; }
        [Parameter("Show previous HL", Group = "TF3", DefaultValue = true)]
        public bool tf3_show_hl { get; set; }
        [Parameter("Fill previous HL", Group = "TF3", DefaultValue = false)]
        public bool tf3_show_hlfill { get; set; }
        [Parameter("Show Close Levels", Group = "TF3", DefaultValue = false)]
        public bool tf3_show_close { get; set; }
        [Parameter("Show Open Levels", Group = "TF3", DefaultValue = true)]
        public bool tf3_show_open { get; set; }
        [Parameter("Show HLC3 (Pivot) Levels", Group = "TF3", DefaultValue = false)]
        public bool tf3_show_hlc3 { get; set; }
        [Parameter("Show 61% Extensions", Group = "TF3", DefaultValue = true)]
        public bool tf3_show_extensions { get; set; }

        //////////////////////////////////////////////////////////////////////// GENERAL PARAMETERS
        [Parameter("Lookback (Days)", Group = "GENERAL", DefaultValue = 7, MinValue = 0, MaxValue = 100)]
        public int lookback_length { get; set; }

        [Parameter("Show Labels", Group = "GENERAL", DefaultValue = true)]
        public bool show_Labels { get; set; }

        //////////////////////////////////////////////////////////////////////// COLOR PARAMETERS
        [Parameter("Open Levels Color", Group = "COLORS", DefaultValue = "Fuchsia")]
        public string col_param_open { get; set; }
        [Parameter("Close Levels Color", Group = "COLORS", DefaultValue = "Gray")]
        public string col_param_close { get; set; }
        [Parameter("HLC3 Levels Color", Group = "COLORS", DefaultValue = "Yellow")]
        public string col_param_hlc3 { get; set; }
        [Parameter("HL Levels Color", Group = "COLORS", DefaultValue = "Gray")]
        public string col_param_hl { get; set; }
        [Parameter("61% Extensions High Color", Group = "COLORS", DefaultValue = "Red")]
        public string col_param_extH { get; set; }
        [Parameter("61% Extensions Low Color", Group = "COLORS", DefaultValue = "Lime")]
        public string col_param_extL { get; set; }
        [Parameter("HL BG Transp (0-255)", Group = "COLORS", DefaultValue = 50, MinValue = 0, MaxValue = 255)]
        public int col_param_hltransp { get; set; }

        private Color col_open, col_close, col_hlc3, col_hl, col_extH, col_extL;

        private Bars dailybars;
        private Bars minutebars;

        //////////////////////////////////////////////////////////////////////// INITIALIZE
        protected override void Initialize()
        {
            // Convert Color strings to color value
            col_open = Color.FromArgb(255, Color.FromName(col_param_open).R, Color.FromName(col_param_open).G, Color.FromName(col_param_open).B);
            col_close = Color.FromArgb(255, Color.FromName(col_param_close).R, Color.FromName(col_param_close).G, Color.FromName(col_param_close).B);
            col_hlc3 = Color.FromArgb(255, Color.FromName(col_param_hlc3).R, Color.FromName(col_param_hlc3).G, Color.FromName(col_param_hlc3).B);
            col_hl = Color.FromArgb(255, Color.FromName(col_param_hl).R, Color.FromName(col_param_hl).G, Color.FromName(col_param_hl).B);
            col_extH = Color.FromArgb(255, Color.FromName(col_param_extH).R, Color.FromName(col_param_extH).G, Color.FromName(col_param_extH).B);
            col_extL = Color.FromArgb(255, Color.FromName(col_param_extL).R, Color.FromName(col_param_extL).G, Color.FromName(col_param_extL).B);

            // get daily bars for lookback length
            dailybars = MarketData.GetBars(TimeFrame.Daily);

            // get minute bars for Label position
            minutebars = MarketData.GetBars(TimeFrame.Minute);
        }

        //////////////////////////////////////////////////////////////////////// MAIN CALCULATION
        public override void Calculate(int index)
        {
            // Abort and show warning if any Timeframe is set to < 1H
            if (tf1 < TimeFrame.Hour || tf2 < TimeFrame.Hour || tf3 < TimeFrame.Hour)
            {
                Chart.DrawText("Warning", "Intraday POI: \r\nDont set any TF to under 1H", Bars.LastBar.OpenTime, Bars.LastBar.High, Color.Red);
                return;
            }


            // Get Time
            int index2 = dailybars.OpenTimes.GetIndexByTime(Bars.OpenTimes[index]);
            // plot only x Days
            if (dailybars.ClosePrices.Count - index2 > lookback_length && lookback_length != -1)
                return;

            // minute difference between bars
            var timeFrameMinutes = (int)(Bars.OpenTimes[index] - Bars.OpenTimes[index - 1]).TotalMinutes;

            // prevent showing up on < 3m chart
            if (timeFrameMinutes < 3)
                return;


            //Call functions depending on timeframe
            if (tf1_show && timeFrameMinutes >= tf1_mintf && timeFrameMinutes <= tf1_maxtf)
                PlotLevels(index, tf1, tf1_thickness, tf1_show_open, tf1_show_hl, tf1_show_hlfill, tf1_show_close, tf1_show_hlc3, tf1_show_extensions);

            if (tf2_show && timeFrameMinutes >= tf2_mintf && timeFrameMinutes <= tf2_maxtf)
                PlotLevels(index, tf2, tf2_thickness, tf2_show_open, tf2_show_hl, tf2_show_hlfill, tf2_show_close, tf2_show_hlc3, tf2_show_extensions);

            if (tf3_show && timeFrameMinutes >= tf3_mintf && timeFrameMinutes <= tf3_maxtf)
                PlotLevels(index, tf3, tf3_thickness, tf3_show_open, tf3_show_hl, tf3_show_hlfill, tf3_show_close, tf3_show_hlc3, tf3_show_extensions);
        }


        //////////////////////////////////////////////////////////////////////// PLOT LEVELS
        public void PlotLevels(int index, TimeFrame tf, int thickness, bool show_open, bool show_hlband, bool show_hlbandfill, bool show_close, bool show_hlc3, bool show_extensions)
        {

            // get bars of specific timeframe
            Bars tf_bars = MarketData.GetBars(tf);

            // abort if chart timeframe = choosen indicator timeframe
            if (tf_bars.Count == Bars.Count)
                return;

            int idx1 = tf_bars.OpenTimes.GetIndexByTime(Bars.OpenTimes[index]);
            int idx2 = Bars.OpenTimes.GetIndexByTime(tf_bars.OpenTimes[idx1]);

            // get prices
            double open = tf_bars.OpenPrices[idx1];
            double high = tf_bars.HighPrices[idx1 - 1];
            double low = tf_bars.LowPrices[idx1 - 1];
            double close = tf_bars.ClosePrices[idx1 - 1];
            double hlc3 = (high + low + close) / 3;
            double extH = high + 0.61 * (high - low);
            double extL = low - 0.61 * (high - low);

            // draw Open
            if (show_open)
                Chart.DrawTrendLine(tf.ToString() + "open" + idx1, idx2, open, index, open, col_open, thickness);

            // draw HLBands
            if (show_hlband)
            {
                Chart.DrawTrendLine(tf.ToString() + "previous high" + idx1, idx2, high, index, high, col_hl, thickness);
                Chart.DrawTrendLine(tf.ToString() + "previous low" + idx1, idx2, low, index, low, col_hl, thickness);
            }

            // fill HL-Bands
            if (show_hlbandfill)
                Chart.DrawRectangle(tf.ToString() + "R Area " + idx1, idx2, high, index, low, Color.FromArgb(col_param_hltransp, 150, 150, 150)).IsFilled = true;

            // show close
            if (show_close)
                Chart.DrawTrendLine(tf.ToString() + "Close" + idx1, idx2, close, index, close, col_close, thickness);

            // show hlc3
            if (show_hlc3)
                Chart.DrawTrendLine(tf.ToString() + "HLC3" + idx1, idx2, hlc3, index, hlc3, col_hlc3, thickness);

            // show Percent extensions
            if (show_extensions)
            {
                Chart.DrawTrendLine(tf.ToString() + "Extension high" + idx1, idx2, extH, index, extH, Color.Red, thickness);
                Chart.DrawTrendLine(tf.ToString() + "Extension low" + idx1, idx2, extL, index, extL, Color.Lime, thickness);
            }

            // show Labels
            int labelpos = Bars.OpenTimes.GetIndexByTime(minutebars.LastBar.OpenTime) + 1;
            if (show_Labels && tf_bars.Count == idx1 + 1)
            {
                string tftxt = tf.ToString();

                // remove old labels on new bar
                Chart.RemoveObject("Label Open" + open + (index - 1).ToString());
                Chart.RemoveObject("Label Close" + close + (index - 1).ToString());
                Chart.RemoveObject("Label HLC3" + hlc3 + (index - 1).ToString());
                Chart.RemoveObject("Label High" + high + (index - 1).ToString());
                Chart.RemoveObject("Label Low" + low + (index - 1).ToString());
                Chart.RemoveObject("Label Extension" + extH + (index - 1).ToString());
                Chart.RemoveObject("Label Extension" + extL + (index - 1).ToString());


                if (show_open)
                    Chart.DrawText("Label Open" + open + index, tftxt + " Open", labelpos, open, col_open);

                if (show_close)
                    Chart.DrawText("Label Close" + close + index, tftxt + " Close", labelpos, close, col_close);

                if (show_hlc3)
                    Chart.DrawText("Label HLC3" + hlc3 + index, tftxt + " HLC3", labelpos, hlc3, col_hlc3);

                if (show_hlband)
                {
                    Chart.DrawText("Label High" + high + index, "prev. " + tftxt + " High", labelpos, high, col_hl);
                    Chart.DrawText("Label Low" + low + index, "prev. " + tftxt + " Low", labelpos, low, col_hl);
                }

                if (show_extensions)
                {
                    Chart.DrawText("Label Extension" + extH + index, "" + tftxt + " 61% Extension", labelpos, extH, col_extH);
                    Chart.DrawText("Label Extension" + extL + index, "" + tftxt + " 61% Extension", labelpos, extL, col_extL);
                }

            }
        }
    }
}
DontMatter
Joined on 15.11.2019
- Distribution: Free
- Language: C#
- Trading platform: cTrader Automate
- File name: Intraday POI 1.3.algo
- Rating: 5
- Installs: 3880
- Modified: 13/10/2021 09:54

Comments
Good indicator, customizable and clean.
I likethis indicator. Can you add the name of the weekday. Also, can you make a video of how to use it based on any settings of your choice?
Yes, I use this from now on...
Could u the look back period do individually for each timeframe?
Could u add up/down tick volume profile (daily, weekly) based on the timeframe look back period...
Thats the logic lol
I Think its actually not possible to set minvalue for Timeframe in Indicator Settings (or at least i couldn't figure out how it can be done), therefore i added that message to prevent a messed up chart.
HI,
that added logic to prevent setting any Timeframe to < 1H dont work.
I get a message "Iintraday POI; don set TF under H1
Thanks
why would you set timeframe to 5min ? Indicator is intended to give macro view (1H+) on lower timeframes.
I added some logic to prevent this
http://icmarkets.ctrader.com/images/screens/bfnDn.png
http://icmarkets.ctrader.com/images/screens/0fnDn.png
looks not good
Great Work, thanks
updated
Hi, sorry but can you edit which Lines are what? Colour? Thank
actually no, but i will add that option too
Hi, sorry but can you edit which Lines are what? Colour? Thanks
3 different (customizable) Timeframes with:
- previous high and low bands (option to fill them)
- previous close line
- current open line
- HLC3 (pivot) line
- 61% extension lines (often used as TP)
i will try when i get time
Hi, can you make for this some signals that i can see
- price above the open/hlc3 line -> consider going long, if below -> consider going short
- price above the HL-Band, its considered overbought. price below is considered oversold
Or also display the names of the Lines..that would be great
i hope you like corona beer
Hi what do you think about it to make a cbot from it?
great! but custom timezone is really important… day reset 00:00 or 01:00 for Chicago futures…. etc…