Description
This indicator is an improvement of
.
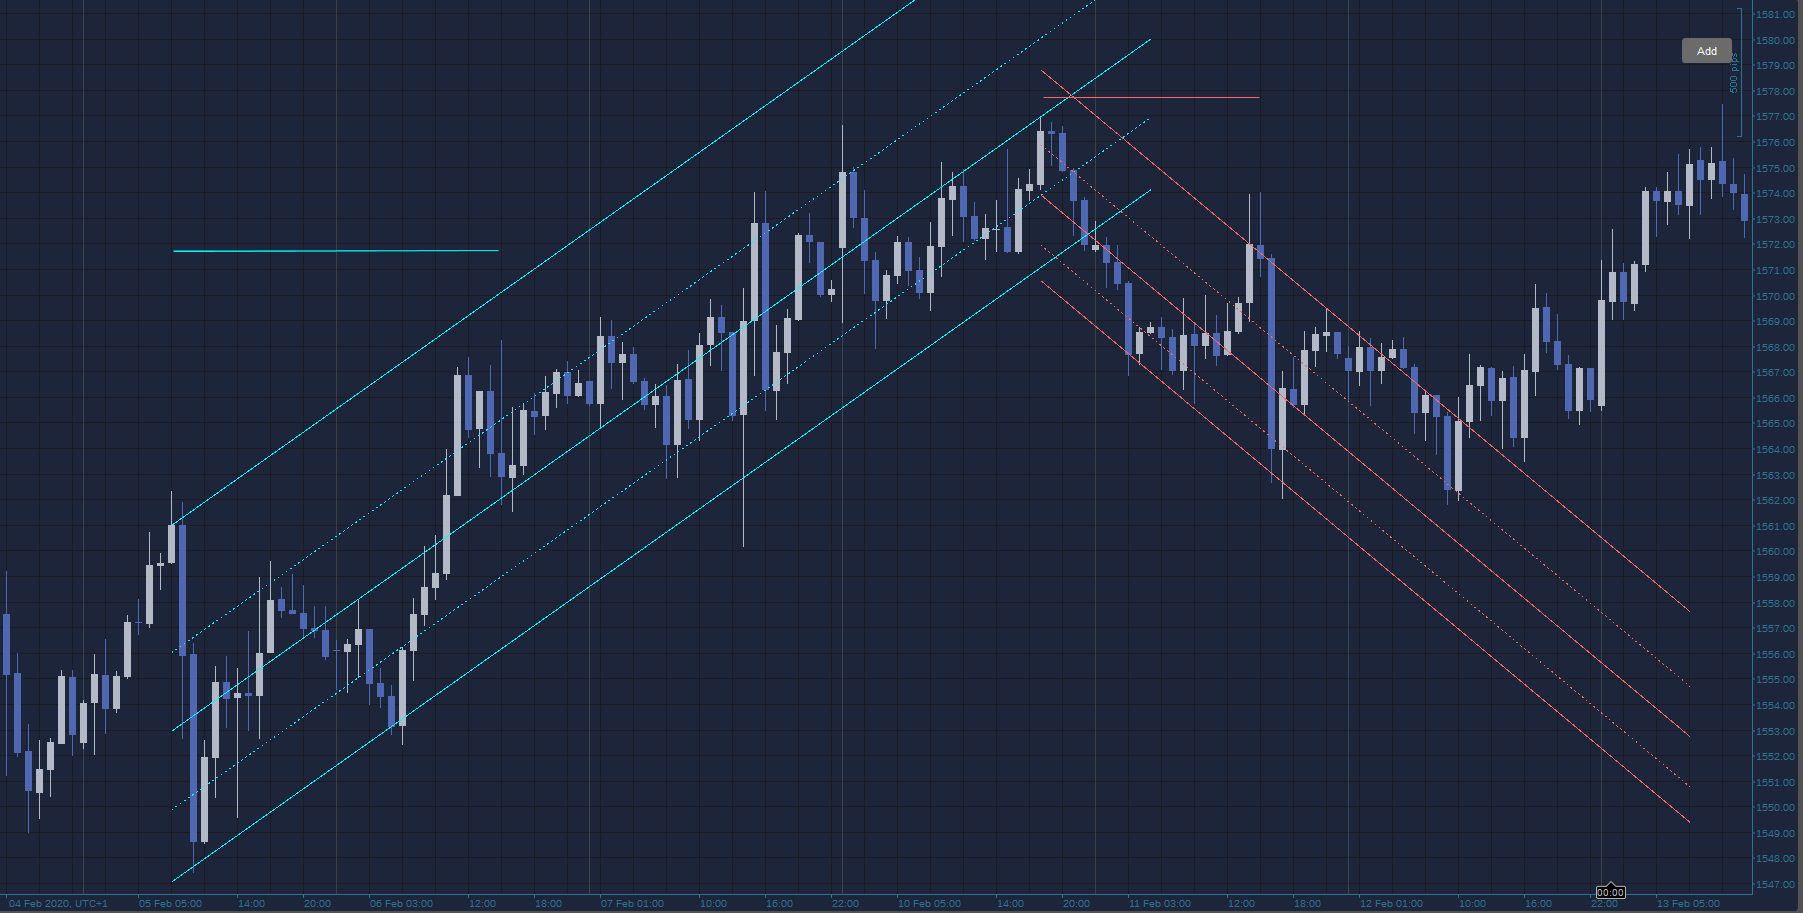
In this version, several, personalized linear regression channels can be added through a button, as examplified below. The horizontal trendlines should be placed on the candles over which the linear regression should be performed.
The projection length parameter is relative to the ratio between the number of candles for which the channel should be projected over the number of candles the channel is calculated on.
using System;
using cAlgo.API;
using cAlgo.API.Internals;
using cAlgo.API.Indicators;
using cAlgo.Indicators;
using System.Collections.Generic;

#pragma warning disable

namespace cAlgo.Indicators
{
    [Indicator(IsOverlay = true, AccessRights = AccessRights.None)]
    public class LinearRegressionChannel : Indicator
    {
        [Parameter("Projection Length", DefaultValue = 50)]
        public int ProjLength { get; set; }

        [Parameter("Center", DefaultValue = true)]
        public bool ShowCenter { get; set; }

        [Parameter("Channel", DefaultValue = true)]
        public bool ShowChannel { get; set; }

        [Parameter("Standard deviation", DefaultValue = true)]
        public bool ShowDeviantion { get; set; }

        public Dictionary<string, LR> LRs = new Dictionary<string, LR>();

        protected override void Initialize()
        {
            ///Add the button in the topleft corner
            Border border = new Border
            {
                VerticalAlignment = VerticalAlignment.Top,
                HorizontalAlignment = HorizontalAlignment.Right,
                Margin = "20 40 20 20",
                Width = 50,
                Child = new Toolbar(this)
            };

            Chart.AddControl(border);

            ///Events for calculating and drawing
            Chart.ObjectUpdated += OnChartObjectUpdated;
            Chart.ObjectRemoved += OnChartObjectRemoved;

            foreach (ChartObject o in Chart.Objects)
                if (o.Name.Length > 24 && o.Name.Substring(0, 24) == "LinearRegressionChannel " && o.IsInteractive && o.ObjectType == ChartObjectType.TrendLine)
                {
                    LRs.Add(o.Name, new LR((ChartTrendLine)o));
                    o.IsInteractive = false;
                    o.IsInteractive = true;
                }
        }

        void OnChartObjectRemoved(ChartObjectRemovedEventArgs obj)
        {
            try
            {
                if (IsCleaning)
                    return;
                RemoveAllObjectsConnectedWith(obj.ChartObject);
                if (LRs.ContainsKey(obj.ChartObject.Name))
                    LRs.Remove(obj.ChartObject.Name);
            } catch (Exception e)
            {
                Print(e);
                Print("Errore nella rimozione dell'oggetto");
            }
        }

        bool IsCleaning = false;

        void RemoveAllObjectsConnectedWith(ChartObject o)
        {
            if (LRs.ContainsKey(o.Name))
            {
                IsCleaning = true;
                for (int i = 0; i < LRs[o.Name].Children.Count; ++i)
                {
                    try
                    {
                        Chart.RemoveObject(LRs[o.Name].Children[i].Name);
                    } catch (Exception e)
                    {
                        Print(e);
                        continue;
                    }
                }
            }
            LRs[o.Name].Children.Clear();
            IsCleaning = false;
        }


        public override void Calculate(int index)
        {
        }

        void OnChartObjectUpdated(ChartObjectUpdatedEventArgs obj)
        {
            try
            {
                RemoveAllObjectsConnectedWith(obj.ChartObject);
                ///Check if object is a rectangle and if it's part of this indicator
                if (!LRs.ContainsKey(obj.ChartObject.Name))
                    return;

                ChartTrendLine lr = (ChartTrendLine)obj.ChartObject;

                // Linear regresion
                double sum_x = 0, sum_x2 = 0, sum_y = 0, sum_xy = 0;

                int start = Bars.OpenTimes.GetIndexByTime(lr.Time1);
                int end = Bars.OpenTimes.GetIndexByTime(lr.Time2);

                int length = Math.Abs(end - start) + 1;

                if (start > end)
                {
                    start = Bars.OpenTimes.GetIndexByTime(lr.Time2);
                    end = Bars.OpenTimes.GetIndexByTime(lr.Time1);
                }

                for (int i = start; i <= end; i++)
                {
                    sum_x += 1.0 * i;
                    sum_x2 += 1.0 * i * i;
                    sum_y += Bars[i].Close;
                    sum_xy += Bars[i].Close * i;
                }

                double a = (length * sum_xy - sum_x * sum_y) / (length * sum_x2 - sum_x * sum_x);
                double b = (sum_y - a * sum_x) / length;

                // Calculate maximum and standard devaitions

                double maxUpperDeviation = 0, maxLowerDeviation = 0;
                double sumDevation = 0;

                for (int i = start; i <= end; i++)
                {
                    double price = a * i + b;
                    maxUpperDeviation = Math.Max(Bars[i].Close - price, maxUpperDeviation);
                    maxLowerDeviation = Math.Min(Bars[i].Close - price, maxLowerDeviation);
                    sumDevation += Math.Pow(Bars[i].Close - price, 2.0);
                }

                double stdDeviation = Math.Sqrt(sumDevation / length);

                // draw in future
                end += (int)(length * 0.01 * ProjLength);

                double pr1 = a * start + b;
                double pr2 = a * end + b;

                if (ShowCenter)
                {
                    LRs[lr.Name].Children.Add(Chart.DrawTrendLine("Center " + lr.Name, start, pr1, end, pr2, lr.Color));
                }

                if (ShowChannel)
                {
                    LRs[lr.Name].Children.Add(Chart.DrawTrendLine("Top " + lr.Name, start, pr1 + maxUpperDeviation, end, pr2 + maxUpperDeviation, lr.Color));
                    LRs[lr.Name].Children.Add(Chart.DrawTrendLine("Bottom " + lr.Name, start, pr1 + maxLowerDeviation, end, pr2 + maxLowerDeviation, lr.Color));
                }

                if (ShowDeviantion)
                {
                    LRs[lr.Name].Children.Add(Chart.DrawTrendLine("Dev-Top " + lr.Name, start, pr1 + stdDeviation, end, pr2 + stdDeviation, lr.Color, 1, LineStyle.DotsRare));
                    LRs[lr.Name].Children.Add(Chart.DrawTrendLine("Dev-Bottom " + lr.Name, start, pr1 - stdDeviation, end, pr2 - stdDeviation, lr.Color, 1, LineStyle.DotsRare));
                }
            } catch (Exception)
            {
            }
        }
    }

    public class Toolbar : CustomControl
    {
        LinearRegressionChannel LR;

        public Toolbar(LinearRegressionChannel lr)
        {
            LR = lr;
            var AddButton = new Button
            {
                Text = "Add",
                Style = new Style(DefaultStyles.ButtonStyle),
                Height = 25
            };

            AddButton.Click += AddArea;

            AddChild(AddButton);
        }

        void AddArea(ButtonClickEventArgs e)
        {
            double Y = (LR.Chart.TopY - LR.Chart.BottomY) * 0.6 + LR.Chart.BottomY;
            string name = "LinearRegressionChannel " + LR.Time;
            LR.LRs.Add(name, new LR(LR.Chart.DrawTrendLine(name, LR.Chart.LastVisibleBarIndex - 2, Y, (int)(LR.Chart.LastVisibleBarIndex - (LR.Chart.LastVisibleBarIndex - LR.Chart.FirstVisibleBarIndex) * 0.2), Y, Color.Cyan)));
            LR.LRs[name].Parent.IsInteractive = true;
        }
    }

    public class LR
    {
        public ChartTrendLine Parent;
        public List<ChartTrendLine> Children = new List<ChartTrendLine>();

        public LR(ChartTrendLine cr)
        {
            Parent = cr;
        }
    }
}
CY
cysecsbin.01
Joined on 10.11.2018 Blocked
- Distribution: Free
- Language: C#
- Trading platform: cTrader Automate
- File name: LinearRegressionChannel.algo
- Rating: 0
- Installs: 3304
- Modified: 13/10/2021 09:54

Note that publishing copyrighted material is strictly prohibited. If you believe there is copyrighted material in this section, please use the Copyright Infringement Notification form to submit a claim.
Comments
Log in to add a comment.
No comments found.