Description
Tired of low-resolution volume profiles? this one gets you the resolution and precision you deserve, without compromise.
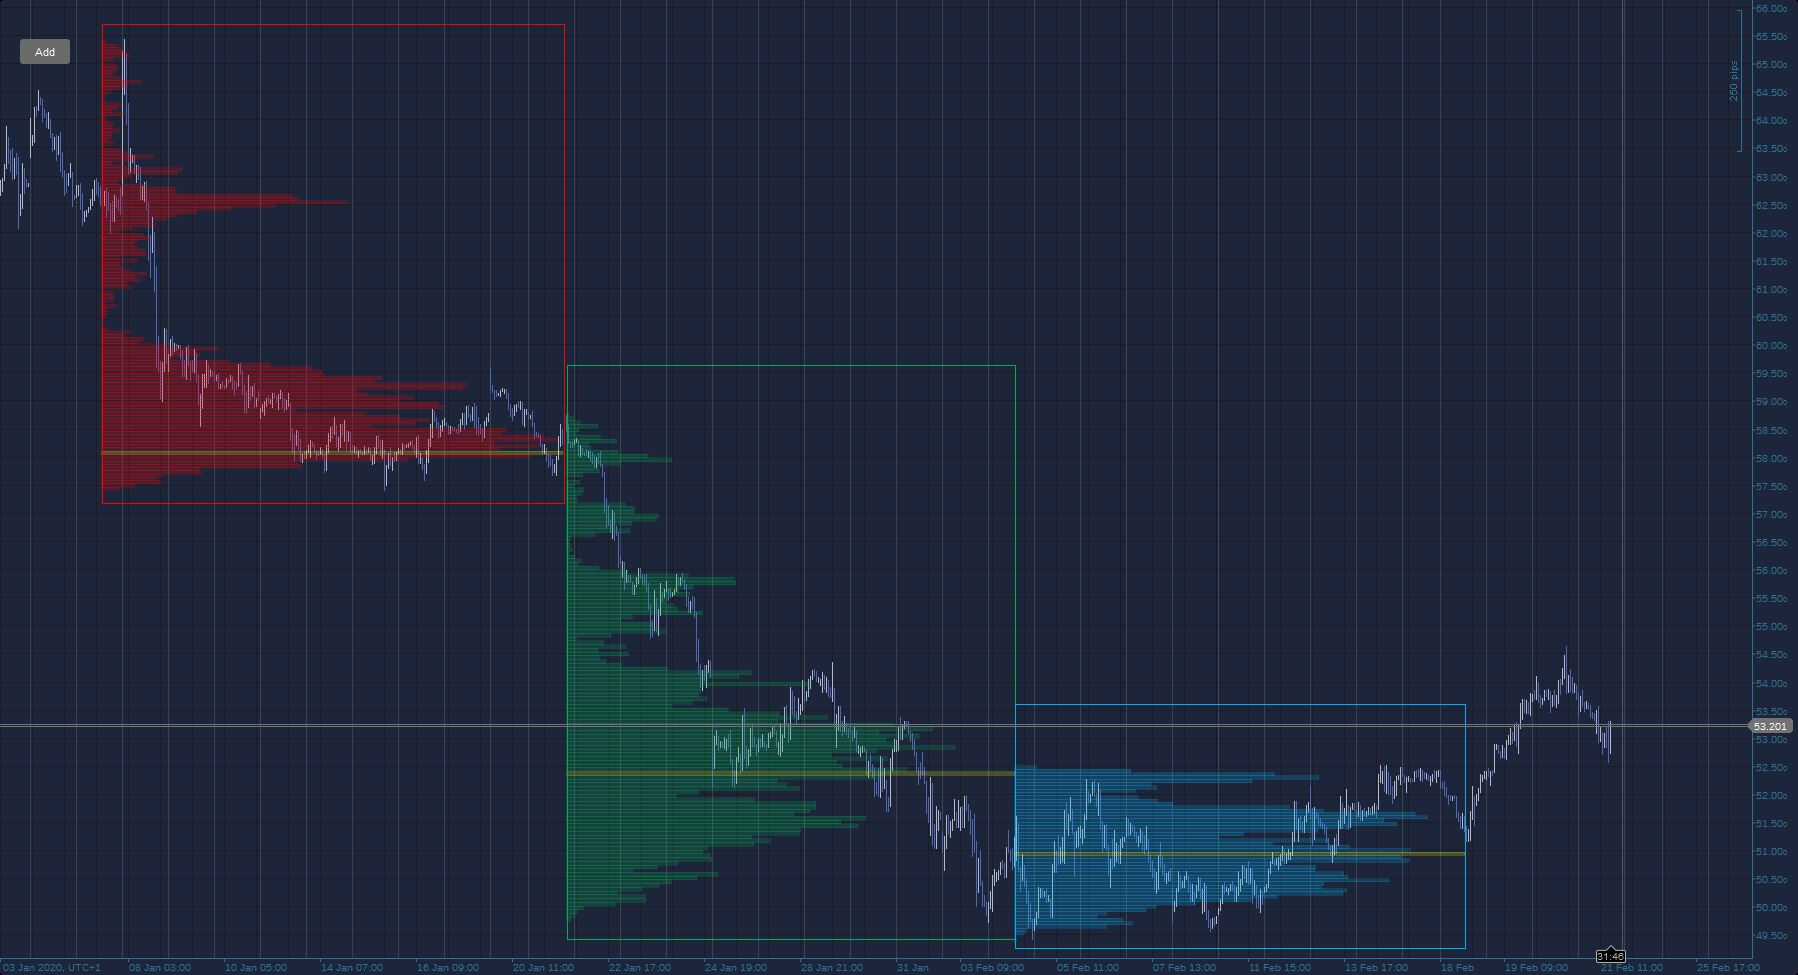
A simple volume profile, to use it, just click the Add button and draw the rectangle where you want to analyze the market, a histogram will appear, telling you how volumes are distributed.
It is still in beta testing, for any bugs and reports please tell me in the comments or join
(Also, it's free)
using System;
using cAlgo.API;
using cAlgo.API.Internals;
using cAlgo.API.Indicators;
using cAlgo.Indicators;
using System.Collections.Generic;

namespace cAlgo
{
    [Indicator(IsOverlay = true, TimeZone = TimeZones.UTC, AccessRights = AccessRights.None)]
    public class VolumeProfile : Indicator
    {
        [Parameter("Segment Width", DefaultValue = 0.5)]
        public double Levels { get; set; }
        [Parameter("Opacity", DefaultValue = 20, MinValue = 0, MaxValue = 100)]
        public int Opacity { get; set; }
        [Parameter("POC Color", DefaultValue = "White")]
        public string PocColor { get; set; }
        [Parameter("Resolution TimeFrame", DefaultValue = 0)]
        public TimeFrame TF { get; set; }

        Bars Minute;
        public Dictionary<string, VP> VPs = new Dictionary<string, VP>();

        protected override void Initialize()
        {
            ///Convert the opacity parameter
            Opacity = Opacity > 100 ? 100 : Opacity < 0 ? 0 : Opacity;
            Opacity = (int)(2.55 * Opacity);

            ///Load minute data which will be used to calculate the volume profile
            Minute = MarketData.GetBars(TF);

            DateTime dt = Minute[0].OpenTime;
            while (Minute[0].OpenTime > Bars[0].OpenTime)
            {
                Minute.LoadMoreHistory();
                Print(Minute[0].OpenTime);
                if (Minute[0].OpenTime == dt)
                {
                    Chart.DrawStaticText("Error", "Could not load all necessary data, try to set a higher timeframe as parameter or check your internet connection", VerticalAlignment.Top, HorizontalAlignment.Right, Color.Yellow);
                    break;
                }
            }

            Print(Minute[0].OpenTime);

            ///Add the button in the topleft corner
            Border border = new Border
            {
                VerticalAlignment = VerticalAlignment.Top,
                HorizontalAlignment = HorizontalAlignment.Left,
                Margin = "20 40 20 20",
                Width = 50,
                Child = new Toolbar(this)
            };

            Chart.AddControl(border);

            ///Events for calculating and drawing
            Chart.ObjectUpdated += OnChartObjectUpdated;
            Chart.ObjectRemoved += OnChartObjectRemoved;

            foreach (ChartObject o in Chart.Objects)
                if (o.Name.Length > 12 && o.Name.Substring(0, 13) == "VolumeProfile" && o.IsInteractive && o.ObjectType == ChartObjectType.Rectangle)
                {
                    VPs.Add(o.Name, new VP((ChartRectangle)o));
                    o.IsInteractive = false;
                    o.IsInteractive = true;
                }
        }

        void OnChartObjectRemoved(ChartObjectRemovedEventArgs obj)
        {
            try
            {
                if (IsCleaning)
                    return;
                RemoveAllObjectsConnectedWith(obj.ChartObject);
                if (VPs.ContainsKey(obj.ChartObject.Name))
                    VPs.Remove(obj.ChartObject.Name);
            } catch (Exception e)
            {
                Print(e);
                Print("Errore nella rimozione dell'oggetto");
            }
        }

        bool IsCleaning = false;

        void RemoveAllObjectsConnectedWith(ChartObject o)
        {
            if (VPs.ContainsKey(o.Name))
            {
                IsCleaning = true;
                for (int i = 0; i < VPs[o.Name].Children.Count; ++i)
                {
                    try
                    {
                        Chart.RemoveObject(VPs[o.Name].Children[i].Name);
                    } catch (Exception e)
                    {
                        Print(e);
                        continue;
                    }
                }
            }
            VPs[o.Name].Children.Clear();
            IsCleaning = false;
        }

        void OnChartObjectUpdated(ChartObjectUpdatedEventArgs obj)
        {
            try
            {
                RemoveAllObjectsConnectedWith(obj.ChartObject);
                ///Check if object is a rectangle and if it's part of this indicator
                if (!VPs.ContainsKey(obj.ChartObject.Name))
                    return;

                ChartRectangle vp = (ChartRectangle)obj.ChartObject;

                ///Define coordinates of the rectangle
                double lowY = vp.Y1, highY = vp.Y2;
                if (lowY > highY)
                {
                    lowY = vp.Y2;
                    highY = vp.Y1;
                }
                DateTime x1 = vp.Time1, x2 = vp.Time2;
                if (x1 > x2)
                {
                    x1 = vp.Time2;
                    x2 = vp.Time1;
                }

                if (x2 >= Bars.OpenTimes.LastValue || x1 <= Bars.OpenTimes[0])
                    return;

                ///Calculate the amplitude of the segments
                double segmentWith = 0;

                int startIndex = Bars.OpenTimes.GetIndexByTime(x1), endIndex = Bars.OpenTimes.GetIndexByTime(x2);
                for (int i = startIndex; i <= endIndex; ++i)
                {
                    segmentWith += Bars[i].High - Bars[i].Low;
                }
                segmentWith /= (endIndex - startIndex + 1);
                segmentWith *= Levels;

                ///Load more m1 bars if necessary
                while (Minute[0].OpenTime > x1)
                    Minute.LoadMoreHistory();

                ///Calculate the number of segments that will be necessary
                int nOfSegments = (int)Math.Ceiling((highY - lowY) / segmentWith);

                ///Create an array to store segments' volumes, the array i filled going from the lowest price to the highest
                ///     i : 0 -> nOfSegments => lowerBound raises
                double[] segments = new double[nOfSegments];

                ///Filling of segments array
                for (int i = 0; i < nOfSegments; ++i)
                {
                    segments[i] = 0;
                    double lowerBound = lowY + segmentWith * i;
                    double upperBound = lowerBound + segmentWith;

                    int minuteStartIndex = Minute.OpenTimes.GetIndexByTime(x1), minuteEndIndex = Minute.OpenTimes.GetIndexByTime(x2);

                    for (int k = minuteStartIndex; k <= minuteEndIndex; ++k)
                    {
                        if (Minute[k].Close >= lowerBound && Minute[k].Close <= upperBound)
                            segments[i] += Minute[k].TickVolume;
                    }
                }

                ///Drawing
                ///Determining the maximum volume recorded in a single segment
                double maxVolume = 0;
                foreach (double volume in segments)
                    maxVolume = Math.Max(maxVolume, volume);

                ///Here the X coordinates of the segment are calculated. The calculation is not trivial since candles do not always span an homogeneous amount of time
                ///First, the proportion between current segment's volume and maxvolume is calculated; then, the result gets trasported in number of candles. Exempla: there are 10 candles in the square, maxVolume is 10000, current segment's volu,e is 6840, then the final result will be (6840/10000)*10 = 6.84
                ///Since there is obviously no candle numbered 6.84, we know we will need to trace the rectangle until the sixth candle, and then calculate the amount of minutes between the 6th and 7th candles, get the 84% out of it and sum it to the total length of the segment.
                for (int i = 0; i < nOfSegments; ++i)
                {
                    if (segments[i] == 0)
                        continue;

                    double lowerBound = lowY + segmentWith * i;
                    double upperBound = lowerBound + segmentWith;

                    double proportion = segments[i] / maxVolume;
                    int numberOfCandles = endIndex - startIndex;

                    double candlesProportion = proportion * numberOfCandles;
                    int extraLength = (int)(Bars[startIndex + (int)candlesProportion + 1].OpenTime.Subtract(Bars[startIndex + (int)candlesProportion].OpenTime).TotalMinutes * (candlesProportion - (int)candlesProportion));

                    ChartRectangle histogramToAdd;

                    if (segments[i] != maxVolume)
                    {
                        Color rectangleColor = vp.Color;
                        histogramToAdd = Chart.DrawRectangle(vp.Name + " " + i, x1, lowerBound, Bars[startIndex + (int)candlesProportion].OpenTime.AddMinutes(extraLength), upperBound, Color.FromArgb(Opacity, rectangleColor.R, rectangleColor.G, rectangleColor.B));
                    }
                    else
                    {
                        Color rectangleColor = Color.FromArgb(Opacity, Color.FromName(PocColor).R, Color.FromName(PocColor).G, Color.FromName(PocColor).B);
                        histogramToAdd = Chart.DrawRectangle(vp.Name + " " + i, x1, lowerBound, Bars[startIndex + (int)candlesProportion].OpenTime.AddMinutes(extraLength), upperBound, rectangleColor);
                    }

                    histogramToAdd.IsFilled = true;
                    VPs[vp.Name].Children.Add(histogramToAdd);
                }
                Print(VPs[vp.Name].Children.Count);
            } catch (Exception e)
            {
                Print(e);
            }
        }

        public override void Calculate(int index)
        {
        }
    }

    public class Toolbar : CustomControl
    {
        VolumeProfile I;

        public Toolbar(VolumeProfile i)
        {
            I = i;
            var AddButton = new Button
            {
                Text = "Add",
                Style = new Style(DefaultStyles.ButtonStyle),
                Height = 25
            };

            AddButton.Click += AddArea;

            AddChild(AddButton);
        }

        void AddArea(ButtonClickEventArgs e)
        {
            double lowY = (I.Chart.TopY - I.Chart.BottomY) * 0.4 + I.Chart.BottomY;
            double highY = (I.Chart.TopY - I.Chart.BottomY) * 0.6 + I.Chart.BottomY;
            string name = "VolumeProfile " + I.Time;
            I.VPs.Add(name, new VP(I.Chart.DrawRectangle(name, I.Chart.LastVisibleBarIndex > I.Chart.BarsTotal - 2 ? I.Chart.BarsTotal - 2 : I.Chart.LastVisibleBarIndex, lowY, I.Chart.LastVisibleBarIndex - 10, highY, Color.Gray)));
            I.VPs[name].Parent.IsInteractive = true;
        }
    }

    public class VP
    {
        public ChartRectangle Parent;
        public List<ChartRectangle> Children = new List<ChartRectangle>();

        public VP(ChartRectangle cr)
        {
            Parent = cr;
        }
    }
}
cysecsbin.01
Joined on 10.11.2018 Blocked
- Distribution: Free
- Language: C#
- Trading platform: cTrader Automate
- File name: CoolProfile.algo
- Rating: 2.5
- Installs: 6069
- Modified: 13/10/2021 09:54

Comments
This is a really cool volume profile done using the Lidz plugin for Adobe Lightroom. It shows you how much of the image you are actually capturing in each area, which can be really helpful when you’re trying to figure out if your exposure is right or if you need to adjust any of your settings. 1v1 lol
Nice work...but i cannot see the colored bars as well as the clear POC.
Moreover, it will be great if there can be different bars for selling and buying volumes.
Nice work thumbs up
This is exactly what I've been looking for!! thank you!!