Description
Posted: Oct 30, 2019
Version Update 2019.12.11
- Corrected small error in average slope calculation /// "for (var i = index - end; i < index - start; i++)" insted of "for (var i = index - end; i =< index - start; i++)"
Description
The Triple Exponential Moving Average (T3) developed by Tim Tillson attempts to offer a moving average with better smoothing then traditional exponential moving average.
It incorporates a smoothing technique which allows it to plot curves more gradual than ordinary moving averages and with a smaller lag. Its smoothness is derived from the fact that it is a weighted sum of a single EMA, double EMA, triple EMA and so on. When a trend is formed, the price action will stay above or below the trend during most of its progression and will hardly be touched by any swings. Thus, a confirmed penetration of the T3 MA and the lack of a following reversal often indicates the end of a trend.
I have added up & down colors and a Min Threshold % factor (generally try values below 0.01) to filter out T3 “flat” periods. Min Threshold % calculates the minimum accepter slope % change between start & stop bars. The filtered out slope is shown in grey. Slope filter is mainly for system development purposes.
Formula
The Triple Exponential Moving Average (T3) of the time series 't' is:
EMA1 = EMA(x,Period)
EMA2 = EMA(EMA1,Period)
GD = EMA1*(1+vFactor)) - (EMA2*vFactor)
T3 = GD (GD ( GD(t, Period, vFactor), Period, vFactor), Period, vFactor);
Where vFactor is a volume factor between 0 and 1 which determines how the moving averages responds. A value of 0 returns an EMA. A value of 1 returns DEMA. Tim Tillson advised or preferred value of 0.7. For longer periods (above 100) to filter out non-trending markets, I prefer to use values between 0-0.3. Many different moving averages can be synthesized by T3 by adjusting Period and vFactor.
How to use
.The T3 Moving Average generally produces entry signals similar to other moving averages and thus is traded largely in the same manner. Here are several assumptions:
If the price action is above the T3 Moving Average and the indicator is headed upward, then we have a bullish trend and should only enter long trades (advisable for novice/intermediate traders). If the price is below the T3 Moving Average and it is edging lower, then we have a bearish trend and should limit entries to short. Below you can see it visualized in a trading platform.
Although the T3 MA is considered as one of the best swing following indicators that can be used on all time frames and in any market, it is still not advisable for novice/intermediate traders to increase their risk level and enter the market during trading ranges (especially tight ones). Thus, for the purposes of this article, we will limit our entry signals only to such in trending conditions.
Once the market is displaying trending behaviour, we can place with-trend entry orders as soon as the price pulls back to the moving average (undershooting or overshooting it will also work). As we know, moving averages are strong resistance/support levels, thus the price is more likely to rebound from them and resume its with-trend direction instead of penetrating it and reversing the trend.
And so, in a bull trend, if the market pulls back to the moving average, we can fairly safely assume that it will bounce off the T3 MA and resume upward momentum, thus we can go long. The same logic is in force during a bearish trend.
And last but not least, the T3 Moving Average can be used to generate entry signals upon crossing with another T3 MA with a longer trackback period (just like any other moving average crossover). When the fast T3 crosses the slower one from below and edges higher, this is called a Golden Cross and produces a bullish entry signal. When the faster T3 crosses the slower one from above and declines further, the scenario is called a Death Cross and signifies bearish conditions.
Below a picture of two T3 indicators with different periods: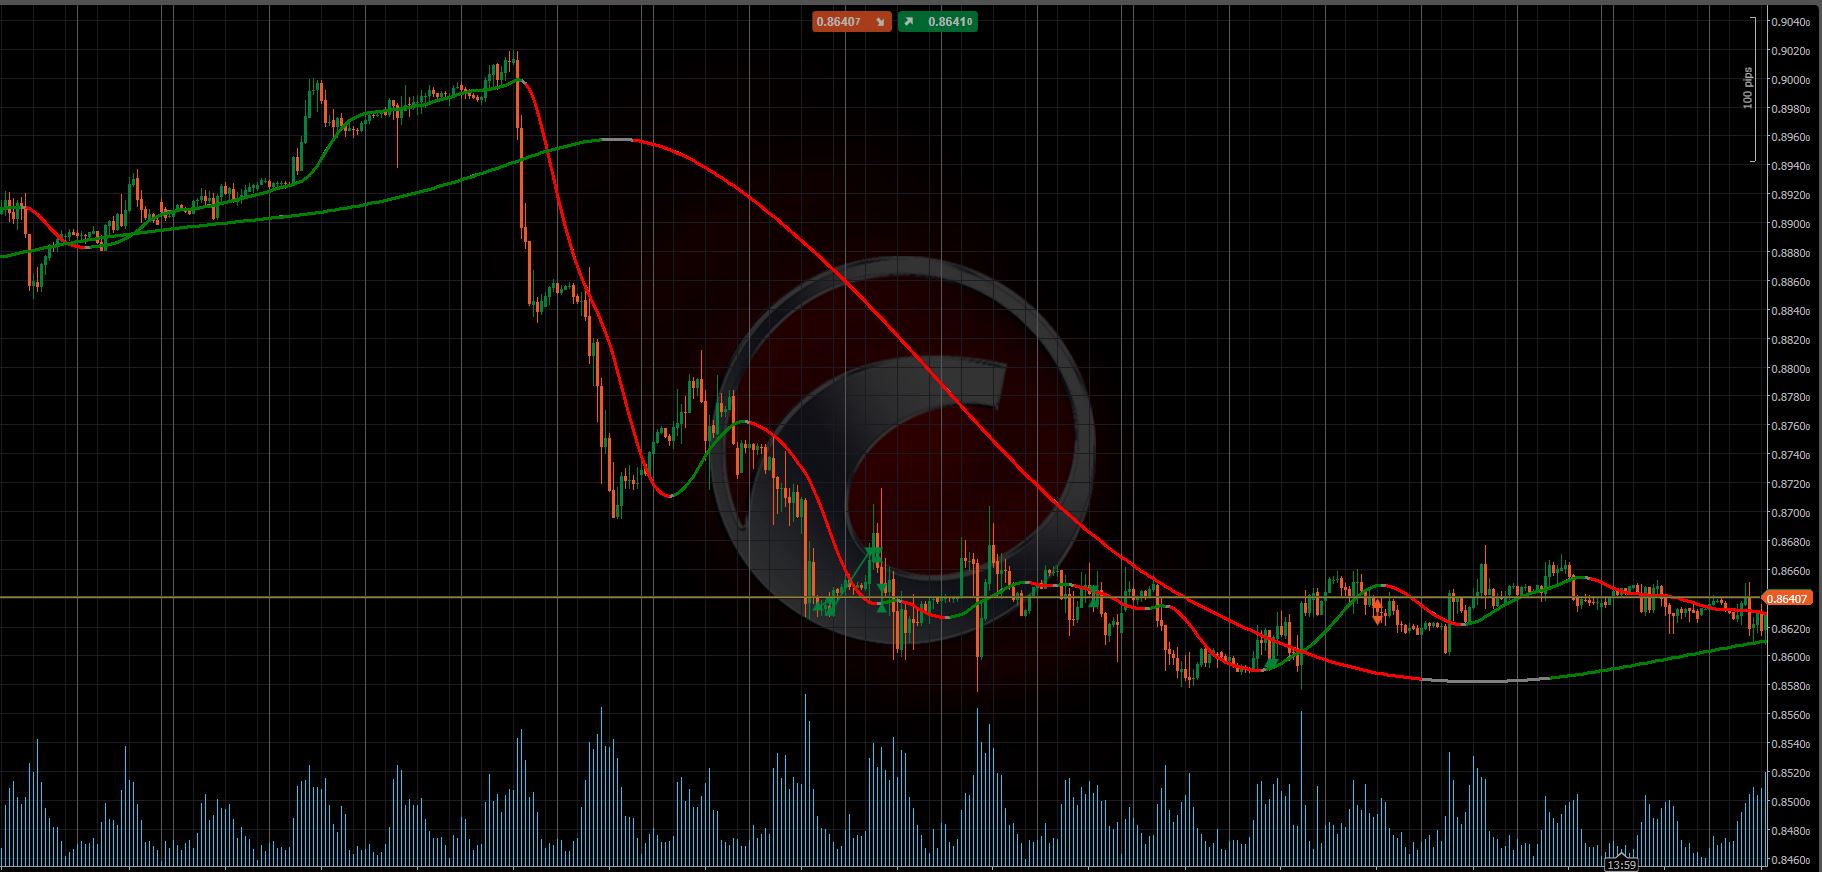
Follow cTrader Telegram group at https://t.me/cTraderCommunity; it's a new community but it will grow fast, plus everyone can talk about cTrader indicators and algorithm without restrictions, though it is not allowed to spam commercial indicators to sell them. There's also a Discord Server now @ https://discord.gg/5GAPMtp
using System;
using System.Linq;
using System.Text;
using System.Threading;
using System.Collections.Generic;
using System.Reflection;
using System.Globalization;
using cAlgo.API;
using cAlgo.API.Indicators;
using cAlgo.API.Internals;
using cAlgo.Indicators;

using System.IO;
namespace cAlgo.Indicators
{

    /*

Version Update  2019.12.11

Corrected small error in average slope calculation  ///  "for (var i = index - end; i < index - start; i++)"  insted of  "for (var i = index - end; i =< index - start; i++)"

*/


    [Indicator(IsOverlay = true, AccessRights = AccessRights.None)]

    public class T3MA : Indicator
    {

        [Parameter()]
        public DataSeries Source { get; set; }

        [Parameter("Period ", DefaultValue = 14)]
        public int Period { get; set; }

        [Parameter("Volume Factor ", DefaultValue = 0.7)]
        public double Volume_Factor { get; set; }

        [Parameter("Min Threshold ", DefaultValue = 0.0, Step = 0.001, MinValue = 0)]
        public double minthr { get; set; }

        [Parameter("Start Bar ", DefaultValue = 1, MinValue = 0)]
        public int startbar { get; set; }

        [Parameter("Stop Bar ", DefaultValue = 2, MinValue = 0)]
        public int stopbar { get; set; }


        [Output("T3MA steady", LineColor = "Gray", PlotType = PlotType.DiscontinuousLine, Thickness = 3)]
        public IndicatorDataSeries steady { get; set; }

        [Output("T3MA rise", LineColor = "Green", PlotType = PlotType.DiscontinuousLine, Thickness = 3)]
        public IndicatorDataSeries rise { get; set; }

        [Output("T3MA fall", LineColor = "Red", PlotType = PlotType.DiscontinuousLine, Thickness = 3)]
        public IndicatorDataSeries fall { get; set; }

        private ExponentialMovingAverage ema1;
        private ExponentialMovingAverage ema2;
        private ExponentialMovingAverage ema3;
        private ExponentialMovingAverage ema4;
        private ExponentialMovingAverage ema5;
        private ExponentialMovingAverage ema6;

        int lastindex = 0;

        protected override void Initialize()
        {
            ema1 = Indicators.ExponentialMovingAverage(Source, Period);
            ema2 = Indicators.ExponentialMovingAverage(ema1.Result, Period);
            ema3 = Indicators.ExponentialMovingAverage(ema2.Result, Period);
            ema4 = Indicators.ExponentialMovingAverage(ema3.Result, Period);
            ema5 = Indicators.ExponentialMovingAverage(ema4.Result, Period);
            ema6 = Indicators.ExponentialMovingAverage(ema5.Result, Period);
        }


        public override void Calculate(int index)
        {


            if (IsLastBar)
            {
                if (index != lastindex)
                    lastindex = index;
                else
                    return;
            }

            var avg = averageslope(startbar, stopbar, index);

            int mode = (avg > minthr) ? 1 : (avg < -minthr) ? -1 : 0;

            var val = maketema(index);

            rise[index] = (mode == 1) ? val : double.NaN;
            fall[index] = (mode == -1) ? val : double.NaN;
            steady[index] = 1.000001 * val;
        }


        double averageslope(int start, int end, int index)
        {

            var sum = 0.0;
            var count = 0;

            for (var i = index - end; i < index - start; i++)
            {
                var p0 = maketema(i + 1);
                var p1 = maketema(i);
                var per = (p0 - p1) / p0 * 100;

                sum += per;
                count++;
            }
            return sum / count;
        }


        double maketema(int index)
        {
            double b, b2, b3, c1, c2, c3, c4;

            b = Volume_Factor;

            b2 = Math.Pow(b, 2);

            // Volume Factor Squared

            b3 = Math.Pow(b, 3);

            // Volume Factor Cubed

            c1 = -b3;

            c2 = 3 * b2 + 3 * b3;

            c3 = -6 * b2 - 3 * b - 3 * b3;

            c4 = 1 + 3 * b + b3 + 3 * b2;

            var result = c1 * ema6.Result[index] + c2 * ema5.Result[index] + c3 * ema4.Result[index] + c4 * ema3.Result[index];

            return result;

        }

    }

}

jani
Joined on 05.04.2019
- Distribution: Free
- Language: C#
- Trading platform: cTrader Automate
- File name: T3 Colors.algo
- Rating: 5
- Installs: 3109
- Modified: 13/10/2021 09:54
