Description
Displays Daily, Weekly and Monthly pivot points as well as R1, R2, R3, S1, S2 and S3 levels on the chart. You can select which of these you want to show. It is slso possible to show hourly and 4-hour pivots.
It works on all timeframe types: time, tick, etc...
The program will automatically hide the indicator if there are too few bars of the pivot timeframe in the chart timeframe, i.e. trying to show hourly pivots on a daily chart will automatically hide the indicator...and it will reappear when you change the chart timeframe.
Customizable linetypes, widths and colors per level type.
In case you want to show, for example, three pivot types (i.e. daily, weekly and monthly) on the same chart just insert the indicator 3 times
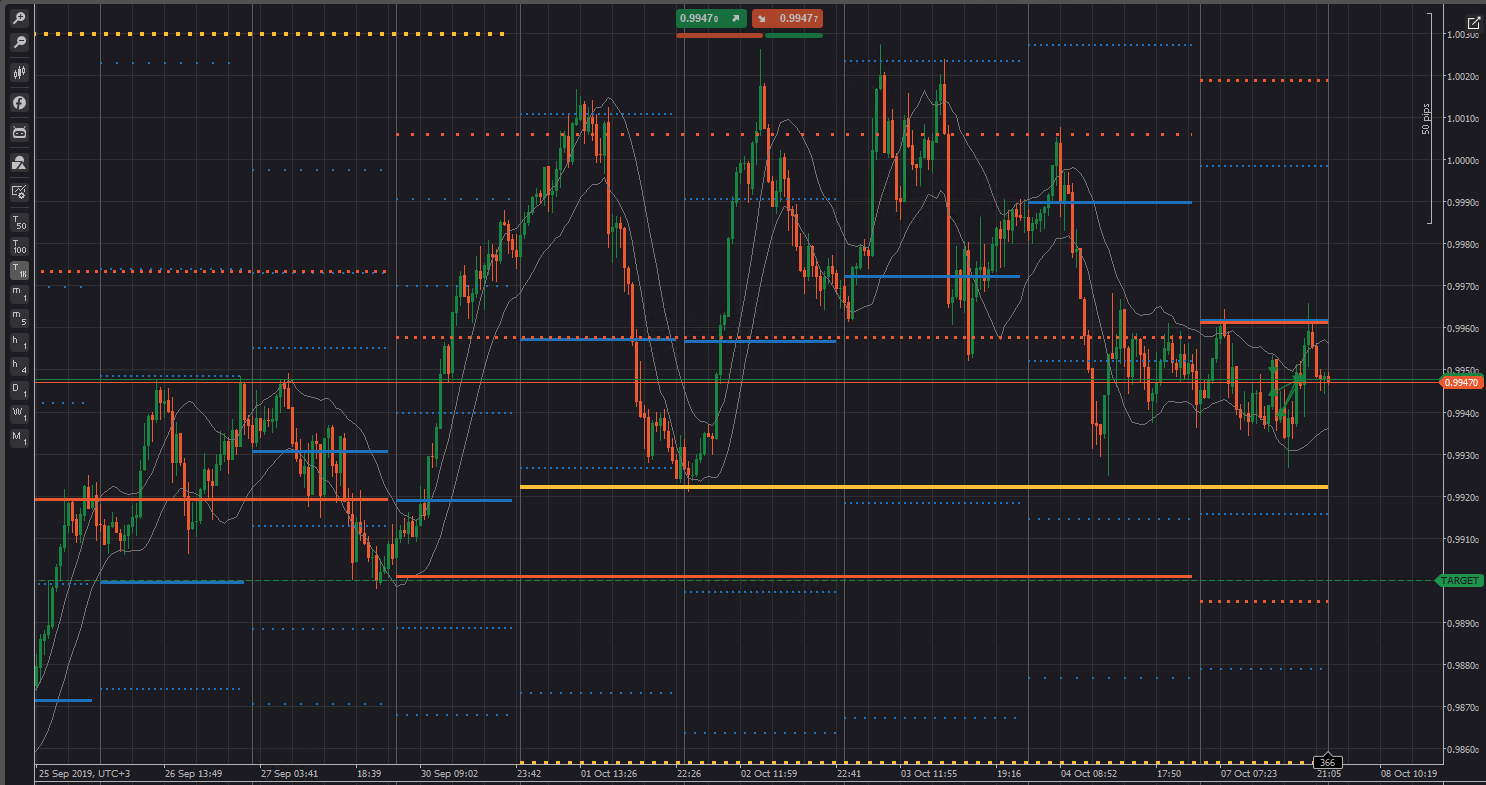
Here a screenshot of my own configuration with daily (light blue), weekly (red) and monthly (orange) pivots and all three S-R levels per pivot, each with different dot-linetype.
Please, note how the monthly pivot starts really at the beginning of the month (Tuesday 1st.Oct) and the weekly at the start of the week (Monday 30th Sep). This seems pretty obvious but it hasn't been the case in many different pivot points indicators that I have found on this site. For example, the Pivot Points indicator that you can find in cTrader Web doesn't do this job very well....and it doesn't appear at all if the selected timeframe is not a time-based timeframe but that is something different.
I hope you find this indicator useful.
Developed by ZoA
// *******************************************************
// *************** PIVOT POINTS INDICATOR ****************
// *******************************************************
//
// Displays Daily, Weekly and Monthly pivot points as well as R1, R2, R3, S1, S2 and S3 levels on the chart.
//
// Also possible to show hourly and 4-hour pivots
//
// It works on all timeframe types: time, tick, etc...
//
// The program will automatically hide the indicator if there are too few bars of the pivot timeframe in the chart timeframe
//      i.e. trying to show hourly pivots on a daily chart will automatically hide the indicator
//
// In case you want for example three pivot types (daily, weekly and monthly) just insert the indicator 3 times
//
// Customizable linetypes, widths and colors per level type
//
// Developed by ZoA
// ********************************************************
//

using System;
using cAlgo.API;
using cAlgo.API.Internals;
using cAlgo.API.Indicators;

namespace cAlgo.Indicators
{
    [Indicator(IsOverlay = true, AutoRescale = false, TimeZone = TimeZones.ArabicStandardTime, AccessRights = AccessRights.None)]
    public class PivotPoints : Indicator
    {
        private DateTime _prevBarTime;
        private DateTime _prevPivotTFbarTime;
        private TimeFrame PivotTimeFrame;
        private MarketSeries seriesPivotTF;

        //default: don't show pivots, activate in Initialize()only if enough bars
        private bool showPivot = false;

        //list of interesting pivot TFs
        public enum pivotTFs
        {
            Daily,
            Weekly,
            Monthly,
            Hourly,
            Hours4x
        }

        [Parameter("Pivot TF:", DefaultValue = "Daily")]
        public pivotTFs pivotTF { get; set; }

        // I keep the following but commented out, for the case it would be interesting to select ANY possible timeframe for the pivots and levels
        // In that case, comment out the line above where PivotTimeFrame is declared
        //[Parameter("Pivot TF")]
        //public TimeFrame PivotTimeFrame { get; set; }

        [Output("Pivot Line", PlotType = PlotType.DiscontinuousLine, LineColor = "#02AFF1", Thickness = 3)]
        public IndicatorDataSeries pivotD { get; set; }
        [Output("R1", PlotType = PlotType.DiscontinuousLine, LineStyle = LineStyle.Dots, LineColor = "#02AFF1", Thickness = 3)]
        public IndicatorDataSeries R1line { get; set; }
        [Output("S1", PlotType = PlotType.DiscontinuousLine, LineStyle = LineStyle.Dots, LineColor = "#02AFF1", Thickness = 3)]
        public IndicatorDataSeries S1line { get; set; }
        [Output("R2", PlotType = PlotType.DiscontinuousLine, LineStyle = LineStyle.DotsRare, LineColor = "#02AFF1", Thickness = 3)]
        public IndicatorDataSeries R2line { get; set; }
        [Output("S2", PlotType = PlotType.DiscontinuousLine, LineStyle = LineStyle.DotsRare, LineColor = "#02AFF1", Thickness = 3)]
        public IndicatorDataSeries S2line { get; set; }
        [Output("R3", PlotType = PlotType.DiscontinuousLine, LineStyle = LineStyle.DotsVeryRare, LineColor = "#02AFF1", Thickness = 3)]
        public IndicatorDataSeries R3line { get; set; }
        [Output("S3", PlotType = PlotType.DiscontinuousLine, LineStyle = LineStyle.DotsVeryRare, LineColor = "#02AFF1", Thickness = 3)]
        public IndicatorDataSeries S3line { get; set; }

        // I would like to show labels per level (as P, R1,S1 and so on) but a way for these to detect whether the corresponding level has been
        // hidden on the part of the user (unchecked in parameters) doesn't seem to exist, so that the labels won't automatically hide
        // which is very annoying.
        // It is apparently also not possible that the labels automatically get the color of the corresponding level,
        // which is also very annoying.
        //
        // So, best course of action, just don't show labels, nor the possibility to activate them

        //[Parameter("Show Labels", DefaultValue = true)]
        //public bool ShowLabels { get; set; }
        bool ShowLabels = false;
        // declare the corresponding variable for the code below in the labels part
        protected override void Initialize()
        {
            //set the chosen timeframe for pivot calculation
            switch (pivotTF)
            {
                case pivotTFs.Hourly:
                    PivotTimeFrame = TimeFrame.Hour;
                    break;
                case pivotTFs.Hours4x:
                    PivotTimeFrame = TimeFrame.Hour4;
                    break;
                case pivotTFs.Daily:
                    PivotTimeFrame = TimeFrame.Daily;
                    break;
                case pivotTFs.Weekly:
                    PivotTimeFrame = TimeFrame.Weekly;
                    break;
                case pivotTFs.Monthly:
                    PivotTimeFrame = TimeFrame.Monthly;
                    break;
                default:
                    PivotTimeFrame = TimeFrame.Daily;
                    break;
            }

            //***** series loading in Pivot TF
            seriesPivotTF = MarketData.GetSeries(PivotTimeFrame);
            //*****

            //SHOW INDICATOR ONLY IF ENOUGH BARS IN CURRENT TF PER BAR IN PIVOT TF
            //check that there are at least a few bars INSIDE one pivot TF bar
            if (MarketSeries.OpenTime[MarketSeries.OpenTime.Count - 3] > seriesPivotTF.OpenTime[seriesPivotTF.OpenTime.Count - 2])
                showPivot = true;
        }


        public override void Calculate(int index)
        {
            //if chart timeframe > pivot timeframe, return
            if (!showPivot)
                return;

            //if only new tick but no new bar, return
            DateTime curBarTime = MarketSeries.OpenTime[index];
            if (curBarTime == _prevBarTime)
                return;

            //if new bar in the chart timeframe
            //which is the previous bar in the pivot TF? (pivot values are calculated using previous completed bar values)
            //***** series loading in Pivot TF
            seriesPivotTF = MarketData.GetSeries(PivotTimeFrame);
            //*****
            var thisPivotTFbarIndex = seriesPivotTF.OpenTime.GetIndexByTime(curBarTime);
            thisPivotTFbarIndex--;
            var thisPivotTFbarTime = seriesPivotTF.OpenTime[thisPivotTFbarIndex];

            //if the pivot TF bar has changed, calculate the new pivots
            if (thisPivotTFbarTime > _prevPivotTFbarTime && curBarTime > thisPivotTFbarTime)
            {
                //first delete the last bar's values, so that there are no "stairs" between two consecutive levels
                pivotD[index - 1] = double.NaN;
                R1line[index - 1] = double.NaN;
                S1line[index - 1] = double.NaN;
                R2line[index - 1] = double.NaN;
                S2line[index - 1] = double.NaN;
                R3line[index - 1] = double.NaN;
                S3line[index - 1] = double.NaN;

                //take just completed pivot TF bar's values
                var high = seriesPivotTF.High[thisPivotTFbarIndex];
                var low = seriesPivotTF.Low[thisPivotTFbarIndex];
                var close = seriesPivotTF.Close[thisPivotTFbarIndex];

                //calculate pivot value
                var pivot = (high + low + close) / 3;

                //calculate S and R values
                var r1 = 2 * pivot - low;
                var s1 = 2 * pivot - high;

                var r2 = pivot + high - low;
                var s2 = pivot - high + low;

                var r3 = high + 2 * (pivot - low);
                var s3 = low - 2 * (high - pivot);

                //set indicator values to be drawn (and labels)
                pivotD[index] = pivot;
                R1line[index] = r1;
                S1line[index] = s1;
                R2line[index] = r2;
                S2line[index] = s2;
                R3line[index] = r3;
                S3line[index] = s3;

                //just to check whether the program read the correct bars
                //Print("curBar" + curBarTime + " - pivot: " + thisPivotTFbarTime + " " + pivotD[index]);

                //store new pivot TF bar's time
                _prevPivotTFbarTime = thisPivotTFbarTime;

                //draw labels
                //SEE NOTES ABOVE
                if (ShowLabels)
                {
                    Chart.DrawText("Lpivot " + curBarTime, "P", index, pivotD[index], "Orange");
                    Chart.DrawText("R1L " + curBarTime, "R1", index, R1line[index], "Orange");
                    Chart.DrawText("S1L " + curBarTime, "S1", index, S1line[index], "Orange");
                    Chart.DrawText("R2L " + curBarTime, "R2", index, R2line[index], "Orange");
                    Chart.DrawText("S2L " + curBarTime, "S2", index, S2line[index], "Orange");
                    Chart.DrawText("R3L " + curBarTime, "R3", index, R3line[index], "Orange");
                    Chart.DrawText("S3L " + curBarTime, "S3", index, S3line[index], "Orange");
                }
            }
            else
            {
                //if not new bar in pivot TF, just copy the previous values
                pivotD[index] = pivotD[index - 1];
                R1line[index] = R1line[index - 1];
                S1line[index] = S1line[index - 1];
                R2line[index] = R2line[index - 1];
                S2line[index] = S2line[index - 1];
                R3line[index] = R3line[index - 1];
                S3line[index] = S3line[index - 1];
            }

            //store time of calculated bar
            _prevBarTime = curBarTime;
        }
    }
}
cgza.bolsa
Joined on 08.10.2019
- Distribution: Free
- Language: C#
- Trading platform: cTrader Automate
- File name: Pivot Points.algo
- Rating: 5
- Installs: 4408
- Modified: 13/10/2021 09:54

Comments
To thrive in this increasingly digital environment, it is essential that enterprises get on to the Android app development bandwagon. Though applications can be developed on various OS, there are some well-defined benefits of developing apps on mobile app user acquisition. The key benefit of Android as a platform is that, it is completely free and it is also an open platform built on Linux.
Hello,
thanks for this indicator. I've updated it to match with the new specifications of CAlgo (no more use of marketSeries.OpenTime) and change the timezone...
I've also adapted this indicator to run sccessfully with renko charts...
Probably post it soon
Best Regards
Cignus
Delicious indicator Carlos .. I hope someone will program a pivot points indicator based on 4 hour levels which can be used on the c-trader platform. This works even better for me than levels on daily. Today I use the ETX platform to get that opportunity and then these 4 hour levels are even updated completely automatically.
Besr regards
Jorgen.
please add mid pivot point ,thanks