Description
Follow my cTrader Telegram group at https://t.me/cTraderCommunity; it's a new community but it will grow fast, plus everyone can talk about cTrader indicators and algorithm without restrictions, though it is not allowed to spam commercial indicators to sell them. There's also a Discord Server now @ https://discord.gg/5GAPMtp
A legend says that accumulation and distribution phases must fit a brachistochrone curve to mark their ending.
This indicator draws a perfect brachistochrone connecting the two points given (make sure to place the points in the right order).
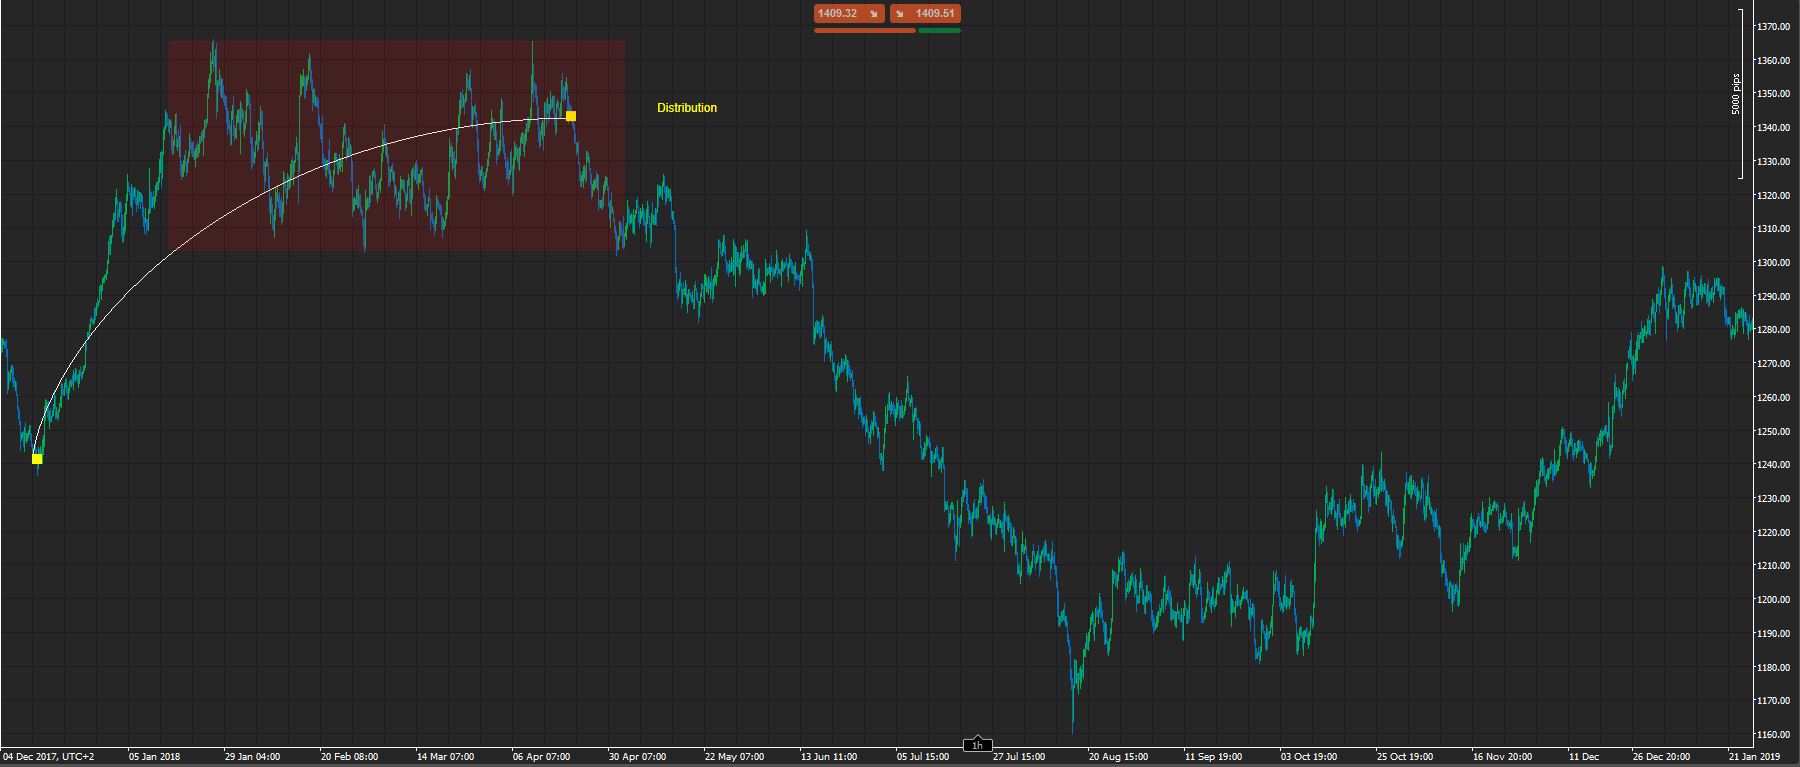
The "Show Variance" parameter acts like a scope that tells you if the brachistochrone curve has a good fit on the market or not; when the bands are close together and their width is less than the average market swing, then you have a good fit, if not, don't even tink about trading a breakout with that drawing.
The "Show Projection" parameter just extends the curve for its other half path, useful in some cases.
using System;
using cAlgo.API;
using cAlgo.API.Internals;
using cAlgo.API.Indicators;
using cAlgo.Indicators;

namespace cAlgo
{
    [Indicator(IsOverlay = true, AutoRescale = false, TimeZone = TimeZones.UTC, AccessRights = AccessRights.None)]
    public class Brachistochrone : Indicator
    {
        [Parameter("Magic Number", DefaultValue = 0)]
        public int mgc { get; set; }
        [Parameter("Icon Color", DefaultValue = "Blue")]
        public string col { get; set; }
        [Parameter("Icon")]
        public ChartIconType icon { get; set; }
        [Parameter("Show Variance", DefaultValue = true)]
        public bool variance { get; set; }
        [Parameter("Show Projection", DefaultValue = false)]
        public bool proj { get; set; }

        [Output("Main", LineColor = "White")]
        public IndicatorDataSeries Result { get; set; }
        [Output("Upper Band", LineColor = "White", LineStyle = LineStyle.DotsRare)]
        public IndicatorDataSeries up { get; set; }
        [Output("Lower Band", LineColor = "White", LineStyle = LineStyle.DotsRare)]
        public IndicatorDataSeries down { get; set; }

        private int x1;
        private int x2;
        private double y1;
        private double y2;

        private string selected = "none";
        private string name;


        protected override void Initialize()
        {
            name = " " + mgc.ToString();
            drawCursors();
            Chart.ObjectHoverChanged += OnChartObjectHoverChanged;
            Chart.MouseUp += OnChartMouseUp;
        }

        void OnChartMouseUp(ChartMouseEventArgs obj)
        {
            if (selected == "Brachi1")
            {
                x1 = (int)obj.BarIndex;
                y1 = (double)obj.YValue;
                drawBrachi();
            }
            if (selected == "Brachi2")
            {
                x2 = (int)obj.BarIndex;
                y2 = (double)obj.YValue;
                drawBrachi();
            }
        }

        void OnChartObjectHoverChanged(ChartObjectHoverChangedEventArgs obj)
        {
            if (!obj.IsObjectHovered)
                selected = "none";
            else
                try
                {
                    if (obj.ChartObject.Name == "Brachi1" + name)
                    {
                        selected = "Brachi1";
                    }
                    else if (obj.ChartObject.Name == "Brachi2" + name)
                    {
                        selected = "Brachi2";
                    }
                    else
                        selected = "none";

                } catch (Exception e)
                {
                    Print(e);
                }
        }

        private void drawCursors()
        {
            int index = Chart.FirstVisibleBarIndex + 10;
            Chart.DrawIcon("Brachi1" + name, icon, index, (Chart.TopY - Chart.BottomY) * 0.75 + Chart.BottomY, Color.FromName(col)).IsInteractive = true;
            Chart.DrawIcon("Brachi2" + name, icon, index, (Chart.TopY - Chart.BottomY) * 0.75 + Chart.BottomY, Color.FromName(col)).IsInteractive = true;
            x1 = index;
            x2 = index;
            y1 = (Chart.TopY - Chart.BottomY) * 0.75 + Chart.BottomY;
            y2 = (Chart.TopY - Chart.BottomY) * 0.75 + Chart.BottomY;
        }

        private void drawBrachi()
        {
            for (int i = 0; i < Chart.BarsTotal + 500; i++)
            {
                up[i] = double.NaN;
                down[i] = double.NaN;
                Result[i] = double.NaN;
            }
            //considerando la brachi incentrata con il punto iniziale x1 nell'origine degli assi, l è la semilunghezza della proiezione sulle ascisse, h è il diametro della circonferenza generatrice
            double l = x2 - x1;
            double h = y2 - y1;
            double k = l / (h * Math.PI / 2);
            for (int i = 0; i < (proj ? l * 2 : l); i++)
            {
                double t = bisect((k * h) / 2, 0.01, i);
                Result[x1 + i] = (h / 2) * (1 - Math.Cos(t)) + y1;
            }
            //drawing variance
            if (variance)
            {
                double sum = 0;
                for (int i = x1; i < x2; i++)
                {
                    sum += !double.IsNaN(Result[i] - MarketSeries.Close[i]) ? Math.Abs(Result[i] - MarketSeries.Close[i]) : 0;
                }
                sum /= x1 - x2;
                for (int i = x1; i < x2; i++)
                {
                    up[i] = Result[i] + sum;
                    down[i] = Result[i] - sum;
                }
            }
        }

        private double bisect(double kh2, double precision, double result)
        {
            double a = 0;
            double b = proj ? 2 * Math.PI + 1 : Math.PI;

            double t = 0;

            if (xFunction(kh2, a, result) * xFunction(kh2, b, result) >= 0)
            {
                return 0;
            }
            while (Math.Abs(xFunction(kh2, t, result)) > precision)
            {
                double mid = (a + b) / 2;
                if (xFunction(kh2, a, result) * xFunction(kh2, mid, result) < 0)
                {
                    b = mid;
                    t = mid;
                }
                else if (xFunction(kh2, b, result) * xFunction(kh2, mid, result) < 0)
                {
                    a = mid;
                    t = mid;
                }
            }
            return t;
        }

        private double xFunction(double kh2, double t, double result)
        {
            return kh2 * (t - Math.Sin(t)) - result;
        }

        public override void Calculate(int index)
        {

        }
    }
}
cysecsbin.01
Joined on 10.11.2018 Blocked
- Distribution: Free
- Language: C#
- Trading platform: cTrader Automate
- File name: Brachistochrone.algo
- Rating: 0
- Installs: 1709
- Modified: 13/10/2021 09:54
