Description
Follow my cTrader Telegram group at https://t.me/cTraderCommunity; it's a new community but it will grow fast, plus everyone can talk about cTrader indicators and algorithm without restrictions, though it is not allowed to spam commercial indicators to sell them. There's also a Discord Server now @ https://discord.gg/5GAPMtp
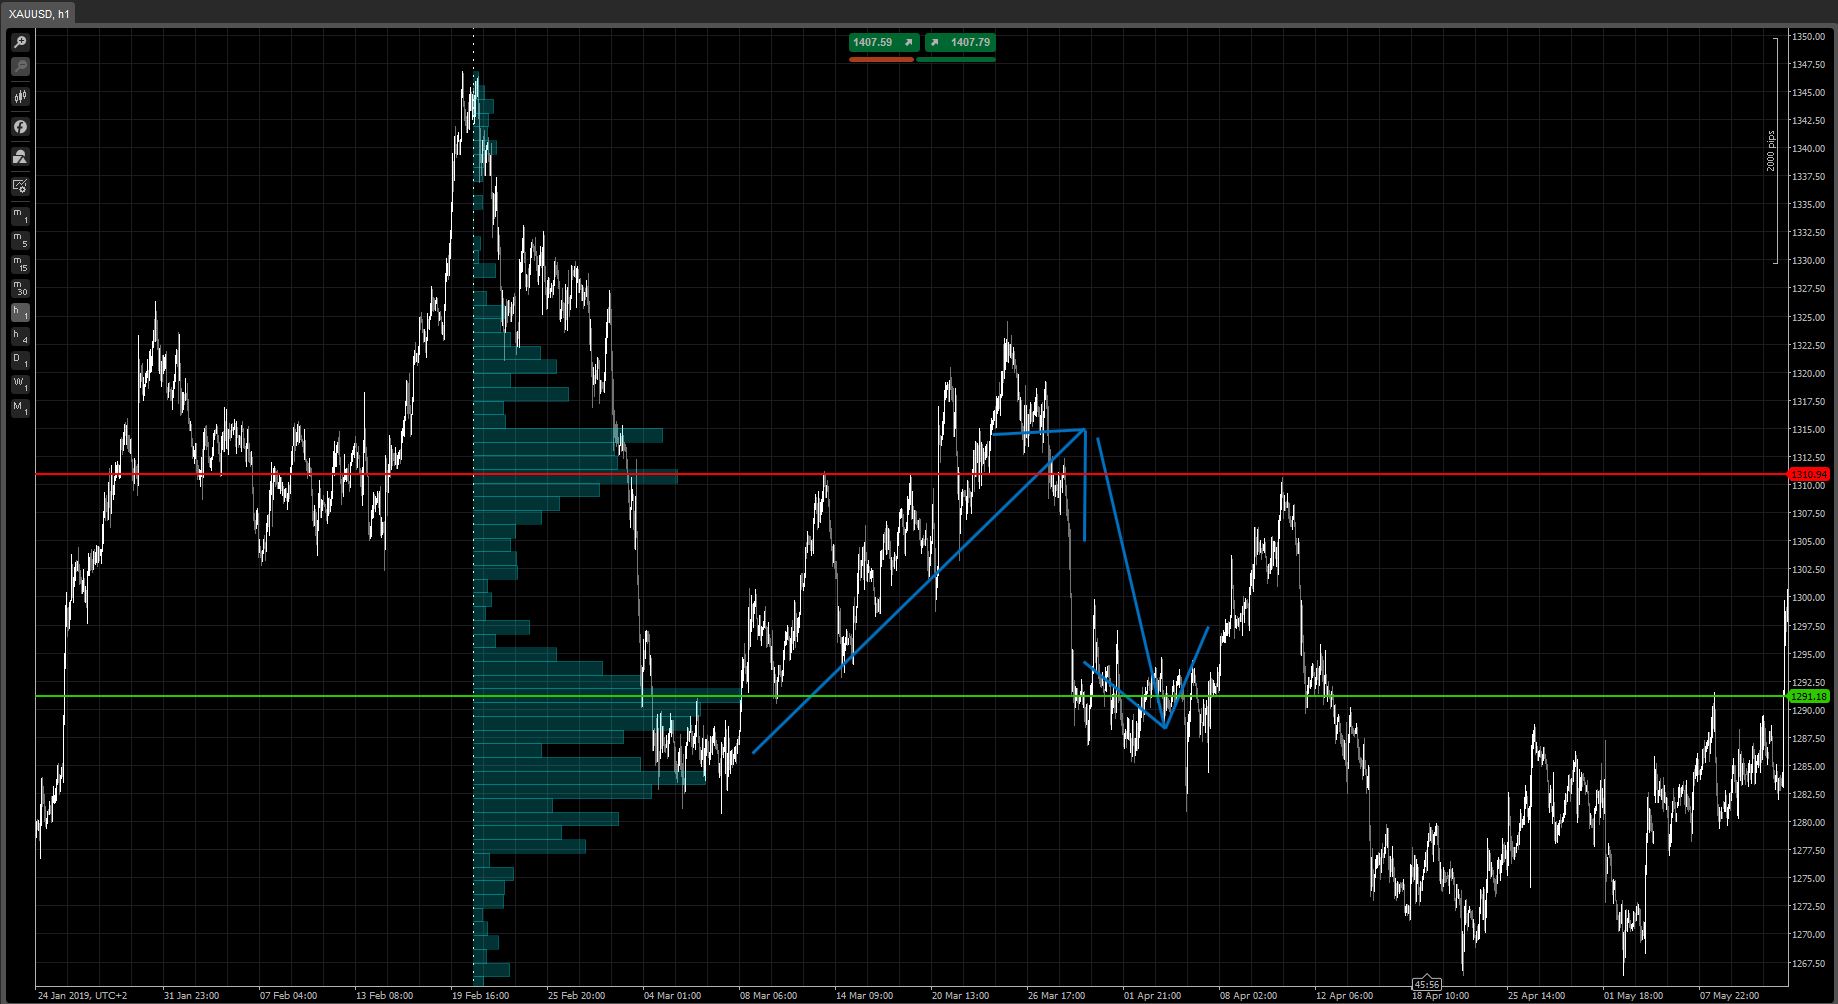
This is my version of the Volume Profile Indicator, it just divides the chart into segment and aggregates tick volume; STILL, a very powerful indicator.
Instructions:
-CTRL + Click to set initial pivot (End of the range to analyze)
-Shift + Click to set range (Start of the range to analyze, must be to the left of the initial pivot)
-Shift + Click on the right of the initial pivot to adjust histogram length
UPDATE: added parameters to show a guide and possibility to set max and min prices with Shift + Alt + click and Shift + Ctrl + Click
For any bug report or suggestion, follow my telegram group or comment below
using System;
using cAlgo.API;
using cAlgo.API.Internals;
using cAlgo.API.Indicators;
using cAlgo.Indicators;

namespace cAlgo
{
    [Indicator(IsOverlay = true, TimeZone = TimeZones.UTC, AccessRights = AccessRights.None)]
    public class VolumeProfile : Indicator
    {
        [Parameter("Resolution", DefaultValue = 20)]
        public int res { get; set; }
        [Parameter("Colored Profile", DefaultValue = false)]
        public bool colored { get; set; }
        [Parameter("Opacity &", DefaultValue = 20)]
        public int opct { get; set; }

        [Parameter("Show Instructions", DefaultValue = false)]
        public bool guide { get; set; }

        private double maxVal = double.NaN, minVal = double.NaN;

        public enum scanMode
        {
            ChartBased,
            UserDefined
        }

        private int position, range, projLength = 50;

        //[Parameter(DefaultValue = scanMode.ChartBased)]
        public scanMode mode = scanMode.UserDefined;
        //{ get; set; }
        protected override void Initialize()
        {
            if (guide)
                Chart.DrawStaticText("guide", "Ctrl + Click to set end point of range to analyze\nShift + Click to set range\nShift + Alt + Click to set maximum price\nShift + Ctrl + Click to set maximum price\n\nClick to dismiss this guide", VerticalAlignment.Center, HorizontalAlignment.Center, Color.Yellow);
            opct = (int)(255 * 0.01 * opct);
            setTimeSpan();
            if (mode == scanMode.ChartBased)
                return;

            Chart.MouseDown += OnChartMouseDown;
        }

        void OnChartMouseDown(ChartMouseEventArgs obj)
        {
            Chart.RemoveObject("guide");
            if (obj.CtrlKey && !obj.AltKey && !obj.ShiftKey)
            {
                range += (int)obj.BarIndex - position;
                position = (int)obj.BarIndex;

                if (range > 0)
                {
                    Chart.DrawTrendLine("maximum", position, maxVal, position - range, maxVal, Color.White, 1, LineStyle.DotsVeryRare);
                    Chart.DrawTrendLine("minimum", position, minVal, position - range, minVal, Color.White, 1, LineStyle.DotsVeryRare);
                    Chart.DrawVerticalLine("_VP Start", position, Color.White, 1, LineStyle.DotsVeryRare);
                    calculateUserDefinedVP();
                }
            }
            else if (!obj.CtrlKey && !obj.AltKey && obj.ShiftKey)
            {
                if (obj.BarIndex < position)
                    range = position - (int)obj.BarIndex;
                else if (obj.BarIndex > position)
                    projLength = (int)obj.BarIndex - position;


                if (range > 0)
                {
                    Chart.DrawTrendLine("maximum", position, maxVal, position - range, maxVal, Color.White, 1, LineStyle.DotsVeryRare);
                    Chart.DrawTrendLine("minimum", position, minVal, position - range, minVal, Color.White, 1, LineStyle.DotsVeryRare);
                    Chart.DrawVerticalLine("_VP End", position - range, Color.White, 1, LineStyle.DotsVeryRare);
                    calculateUserDefinedVP();
                }
            }
            if (!obj.CtrlKey && obj.AltKey && obj.ShiftKey)
            {

                maxVal = obj.YValue;
                Chart.DrawTrendLine("maximum", position, maxVal, position - range, maxVal, Color.White, 1, LineStyle.DotsVeryRare);
                calculateUserDefinedVP();
            }
            if (obj.CtrlKey && !obj.AltKey && obj.ShiftKey)
            {

                minVal = obj.YValue;
                Chart.DrawTrendLine("minimum", position, minVal, position - range, minVal, Color.White, 1, LineStyle.DotsVeryRare);
                calculateUserDefinedVP();
            }
        }

        public override void Calculate(int index)
        {
            if (mode == scanMode.UserDefined)
                return;
            if (!IsLastBar)
                return;

            for (int i = 0; i <= index; i++)
            {

            }
        }

        private void calculateUserDefinedVP()
        {
            double max = 0, min = double.PositiveInfinity;

            for (int i = position; i > position - range; i--)
            {
                max = Math.Max(max, MarketSeries.High[i]);
                min = Math.Min(min, MarketSeries.Low[i]);
            }

            if (!double.IsNaN(maxVal))
                max = Math.Min(max, maxVal);
            if (!double.IsNaN(minVal))
                min = Math.Max(min, minVal);

            double[,] values = new double[res, 2];
            //determining segment's heigth in pips
            double rangePips = (max - min) / res;
            double maxValue = 0;

            for (int i = 0; i < res; i++)
            {
                //inizializza i valori di volume per i segmenti
                values[i, 0] = 0;
                values[i, 1] = 0;
                //definisce i limiti del segmento corrente
                double lowerBound = min + i * rangePips;
                double upperBound = lowerBound + rangePips;

                //popola l'array dei volumi se le condizioni specificate sono soddisfatte
                for (int k = position; k > position - range; k--)
                {
                    if (MarketSeries.Close[k] > lowerBound && MarketSeries.Close[k] < upperBound)
                    {
                        if (MarketSeries.Open[k] < MarketSeries.Close[k])
                            values[i, 0] += MarketSeries.TickVolume[k];
                        else
                            values[i, 1] += MarketSeries.TickVolume[k];
                    }
                }

                maxValue = Math.Max(maxValue, values[i, 0] + values[i, 1]);
            }

            for (int i = 0; i < res; i++)
            {
                int x1 = position;
                int x2 = (int)(x1 + projLength * ((values[i, 0]) / maxValue));
                int x3 = (int)(x2 + projLength * ((values[i, 1]) / maxValue));
                if (colored)
                {
                    Chart.DrawRectangle("_VP Bull" + i, x1, min + i * rangePips, x2, min + (i + 1) * rangePips, Color.FromArgb(opct, 0, 255, 0)).IsFilled = true;
                    Chart.DrawRectangle("_VP Bear" + i, x2, min + i * rangePips, x3, min + (i + 1) * rangePips, Color.FromArgb(opct, 255, 0, 0)).IsFilled = true;
                }
                else
                    Chart.DrawRectangle("_VP Bull" + i, x1, min + i * rangePips, x3, min + (i + 1) * rangePips, Color.FromArgb(opct, 0, 255, 255)).IsFilled = true;
            }

        }

        private void setTimeSpan()
        {

        }
    }
}
cysecsbin.01
Joined on 10.11.2018 Blocked
- Distribution: Free
- Language: C#
- Trading platform: cTrader Automate
- File name: volume Profile.algo
- Rating: 5
- Installs: 7102
- Modified: 13/10/2021 09:54

Great tool. I like it