Description
Follow my cTrader Telegram group at https://t.me/cTraderCommunity; it's a new community but it will grow fast, plus everyone can talk about cTrader indicators and algorithm without restrictions, though it is not allowed to spam commercial indicators to sell them.
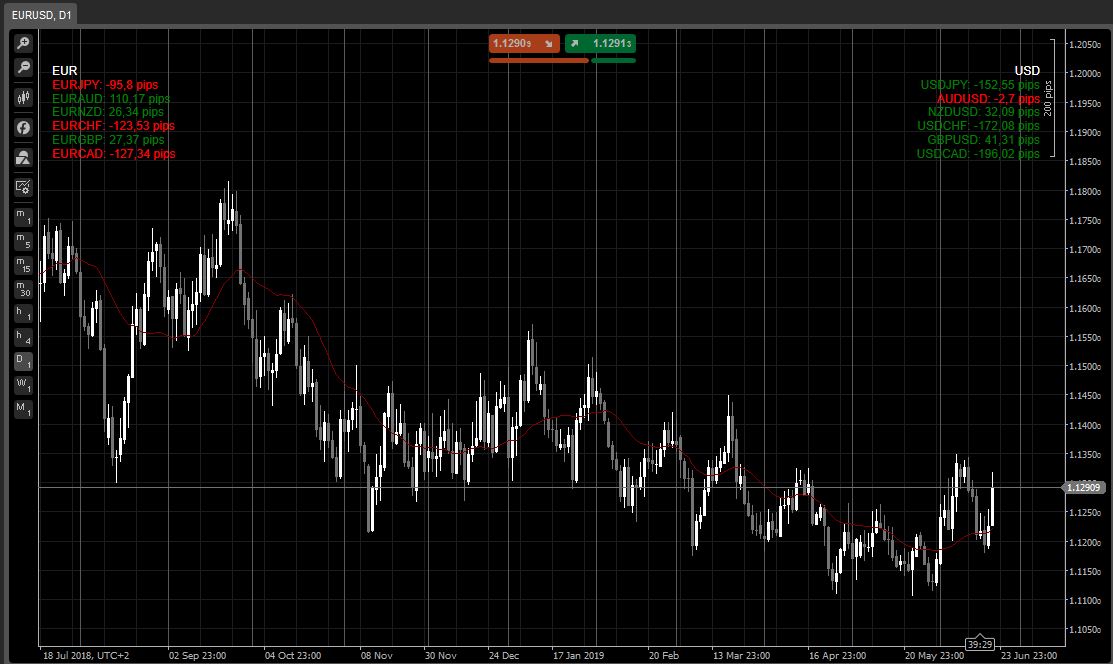
This is a HeatMap that will automatically make out the currencies that make up the current cross and confront them with all the other majors separately.
ONLY USE THIS ON FOREX (obv it won't work with other assets)
USE THIS IF YOU HAVE A FAST INTERNET CONNECTION (since cTrader API isn't thread safe multithreaded download are not allowed, and loading this may take a while if your internet connection is not fast enough)
The Periods parameter modifies the Moving Average used as pivot in the calculations.
The color of the crosses shown is relative to the chart's cross, i.e. if I'm looking at EURUSD and I see USDJPY: -110 pips in green, it is because the influence on the chart's cross is positive/bullish even if is negative/bearish for USDJPY itself.
For any bug or suggestion, comment below or talk to me directly by joining the group above.
Enjoy
using System;
using cAlgo.API;
using cAlgo.API.Internals;
using cAlgo.API.Indicators;
using cAlgo.Indicators;
using System.Collections.Generic;

namespace cAlgo
{
    [Indicator(IsOverlay = true, TimeZone = TimeZones.UTC, AccessRights = AccessRights.None)]
    public class RelativeScreener : Indicator
    {
        [Parameter("Periods", DefaultValue = 24)]
        public int per { get; set; }

        [Output("Main")]
        public IndicatorDataSeries Result { get; set; }

        private SimpleMovingAverage[] firstSmasSeries = new SimpleMovingAverage[7];
        private SimpleMovingAverage[] secondSmasSeries = new SimpleMovingAverage[7];

        private MarketSeries[] firstSeries = new MarketSeries[7];
        private MarketSeries[] secondSeries = new MarketSeries[7];

        private double[] firstPipSizes = new double[7];
        private double[] secondPipSizes = new double[7];

        private string symbol;

        protected override void Initialize()
        {
            symbol = Symbol.Code;
            findCrosses();
            Chart.DrawStaticText("firstCur", Symbol.Code.Substring(0, 3), VerticalAlignment.Top, HorizontalAlignment.Left, Color.White);
            Chart.DrawStaticText("secondCur", Symbol.Code.Substring(3, 3), VerticalAlignment.Top, HorizontalAlignment.Right, Color.White);
        }

        public override void Calculate(int index)
        {

            string spacer = "\n";
            for (int i = 0; i < 7; i++)
            {
                if (firstSeries[i] == null)
                    continue;
                int index1 = firstSeries[i].OpenTime.GetIndexByTime(MarketSeries.OpenTime[index]);
                double pctChange = Math.Round((firstSeries[i].Close[index1] - firstSmasSeries[i].Result[index1]) / firstPipSizes[i], 2);
                if (firstSeries[i].SymbolCode.Substring(0, 3) == Symbol.Code.Substring(0, 3))
                    Chart.DrawStaticText("firstCrosses" + i, spacer + firstSeries[i].SymbolCode + ": " + pctChange + " pips", VerticalAlignment.Top, HorizontalAlignment.Left, pctChange > 0 ? Color.Green : Color.Red);
                else
                    Chart.DrawStaticText("firstCrosses" + i, spacer + firstSeries[i].SymbolCode + ": " + pctChange + " pips", VerticalAlignment.Top, HorizontalAlignment.Left, pctChange > 0 ? Color.Red : Color.Green);
                spacer += "\n";
            }
            spacer = "\n";
            for (int i = 0; i < 7; i++)
            {
                if (secondSeries[i] == null)
                    continue;
                int index1 = secondSeries[i].OpenTime.GetIndexByTime(MarketSeries.OpenTime[index]);
                double pctChange = Math.Round((secondSeries[i].Close[index1] - secondSmasSeries[i].Result[index1]) / secondPipSizes[i], 2);
                if (secondSeries[i].SymbolCode.Substring(0, 3) == Symbol.Code.Substring(3, 3))
                    Chart.DrawStaticText("secondCrosses" + i, spacer + secondSeries[i].SymbolCode + ": " + pctChange + " pips", VerticalAlignment.Top, HorizontalAlignment.Right, pctChange > 0 ? Color.Red : Color.Green);
                else
                    Chart.DrawStaticText("secondCrosses" + i, spacer + secondSeries[i].SymbolCode + ": " + pctChange + " pips", VerticalAlignment.Top, HorizontalAlignment.Right, pctChange > 0 ? Color.Green : Color.Red);
                spacer += "\n";
            }
        }

        public string[] currencies =
        {
            "EUR",
            "USD",
            "JPY",
            "AUD",
            "NZD",
            "CHF",
            "GBP",
            "CAD"
        };

        private void findCrosses()
        {
            if (symbol.Length != 6)
            {
                return;
            }
            string firstCur = symbol.Substring(0, 3);
            string secondCur = symbol.Substring(3, 3);

            int currencyIndex = 0;
            for (int i = 0; i < 7; i++)
            {

                if (firstCur == currencies[i + currencyIndex])
                    currencyIndex++;
                if (firstCur + currencies[i + currencyIndex] == Symbol.Code || currencies[i + currencyIndex] + firstCur == Symbol.Code)
                    continue;
                firstSeries[i] = MarketData.GetSeries(firstCur + currencies[i + currencyIndex], TimeFrame);

                if (firstSeries[i] == null)
                {
                    firstSeries[i] = MarketData.GetSeries(currencies[i + currencyIndex] + firstCur, TimeFrame);
                    try
                    {
                        firstPipSizes[i] = MarketData.GetSymbol(currencies[i + currencyIndex] + firstCur).PipSize;
                    } catch (Exception e)
                    {
                    }
                }
                else
                    firstPipSizes[i] = MarketData.GetSymbol(firstCur + currencies[i + currencyIndex]).PipSize;
            }

            currencyIndex = 0;

            for (int i = 0; i < 7; i++)
            {
                if (secondCur == currencies[i + currencyIndex])
                    currencyIndex++;
                if (secondCur + currencies[i + currencyIndex] == Symbol.Code || currencies[i + currencyIndex] + secondCur == Symbol.Code)
                    continue;
                secondSeries[i] = MarketData.GetSeries(secondCur + currencies[i + currencyIndex], TimeFrame);

                if (secondSeries[i] == null)
                {
                    secondSeries[i] = MarketData.GetSeries(currencies[i + currencyIndex] + secondCur, TimeFrame);
                    try
                    {
                        secondPipSizes[i] = MarketData.GetSymbol(currencies[i + currencyIndex] + secondCur).PipSize;
                    } catch (Exception e)
                    {
                    }
                }
                else
                    secondPipSizes[i] = MarketData.GetSymbol(secondCur + currencies[i + currencyIndex]).PipSize;
            }


//Moving Averages Calculation
            for (int i = 0; i < 7; i++)
            {
                if (firstSeries[i] == null)
                    continue;
                firstSmasSeries[i] = Indicators.SimpleMovingAverage(firstSeries[i].Close, per);
            }

            for (int i = 0; i < 7; i++)
            {
                if (secondSeries[i] == null)
                    continue;
                secondSmasSeries[i] = Indicators.SimpleMovingAverage(secondSeries[i].Close, per);
            }
        }

    }

}
cysecsbin.01
Joined on 10.11.2018 Blocked
- Distribution: Free
- Language: C#
- Trading platform: cTrader Automate
- File name: RelativeScreener.algo
- Rating: 5
- Installs: 2283
- Modified: 13/10/2021 09:54

Comments
Hey Thanks for taking the time.
This is the link:
https://www.mt5traders.com/volatility-quality-metatrader-5-forex-indicator/
This would be great.
Auto Heat Map is a valid tool to scalp during news event. Traders can see what is happening using only one screen. My eyes get strained with too many monitors. It would really be great if we have a way to detect if the news would really affect the price action.
One way I see is to use the Volatility Quality indicator by created by Thomas Stridsman. It uses the indicator’s slope for trend estimation, in addition the indicator uses the % of ATR (Average True Range) in filtering its signals, which automatically adjusts it to the specified symbols and time frames.
Please build VQ for ctrader. Thanks in advance.
Thank you for building the VQ.
Let us all join his group chat.