Description
Follow my cTrader Telegram group at https://t.me/cTraderCommunity; it's a new community but it will grow fast, plus everyone can talk about cTrader indicators and algorithm without restrictions, though it is not allowed to spam commercial indicators to sell them.
This indicator is made to analyze the behaviour of the choosen indicator/s on an hourly basis.
First you must apply the indicator, then, you must choose a source to analyze, in this example we will examine the distance of the closing price from a sma 200.
to calculate the distance i use this little and useful indicator that just... does maths for me without the need of writing another indicator all over again:
using System;
using cAlgo.API;
using cAlgo.API.Internals;
using cAlgo.API.Indicators;
using cAlgo.Indicators;

namespace cAlgo
{
    [Indicator(IsOverlay = false, TimeZone = TimeZones.UTC, AccessRights = AccessRights.None)]
    public class Difference : Indicator
    {
        [Parameter("Difference", DefaultValue = false)]
        public bool diff { get; set; }
        [Parameter("Distance", DefaultValue = false)]
        public bool dist { get; set; }
        [Parameter("Sum", DefaultValue = false)]
        public bool somm { get; set; }
        [Parameter("Product", DefaultValue = false)]
        public bool pro { get; set; }
        [Parameter("Quotient", DefaultValue = false)]
        public bool q { get; set; }
        [Parameter("Cumulative Sum", DefaultValue = false)]
        public bool c { get; set; }
        [Parameter("Source 1")]
        public DataSeries sou1 { get; set; }
        [Parameter("Source 2")]
        public DataSeries sou2 { get; set; }
        [Parameter("Cumulative Sum Periods", DefaultValue = 24)]
        public int per { get; set; }

        [Output("Main")]
        public IndicatorDataSeries Result { get; set; }


        protected override void Initialize()
        {
            // Initialize and create nested indicators
        }

        public override void Calculate(int index)
        {
            if (diff ^ somm ^ pro ^ q ^ c ^ dist)
            {
                if (diff)
                {
                    Result[index] = sou1[index] - sou2[index];
                }
                else if (dist)
                {
                    Result[index] = Math.Abs(sou1[index] - sou2[index]);
                }
                else if (somm)
                {
                    Result[index] = sou1[index] + sou2[index];
                }
                else if (pro)
                {
                    Result[index] = sou1[index] * sou2[index];
                }
                else if (q)
                {
                    Result[index] = sou1[index] / sou2[index];
                }
                else if (c)
                {
                    Result[index] = 0;
                    for (int i = 0; i < per; i++)
                    {
                        Result[index] += sou1[index - i];
                    }
                }
            }
            else if (!diff && !dist && !somm && !pro && !q && !c)
            {
                ChartObjects.DrawText("sadf", "Choose an option", index, 0);
            }
            else
            {
                ChartObjects.DrawText("sadf", "Only one operation is allowed at once", index, 0);
            }
        }
    }
}
so i set this indicator to calculate the difference I want: 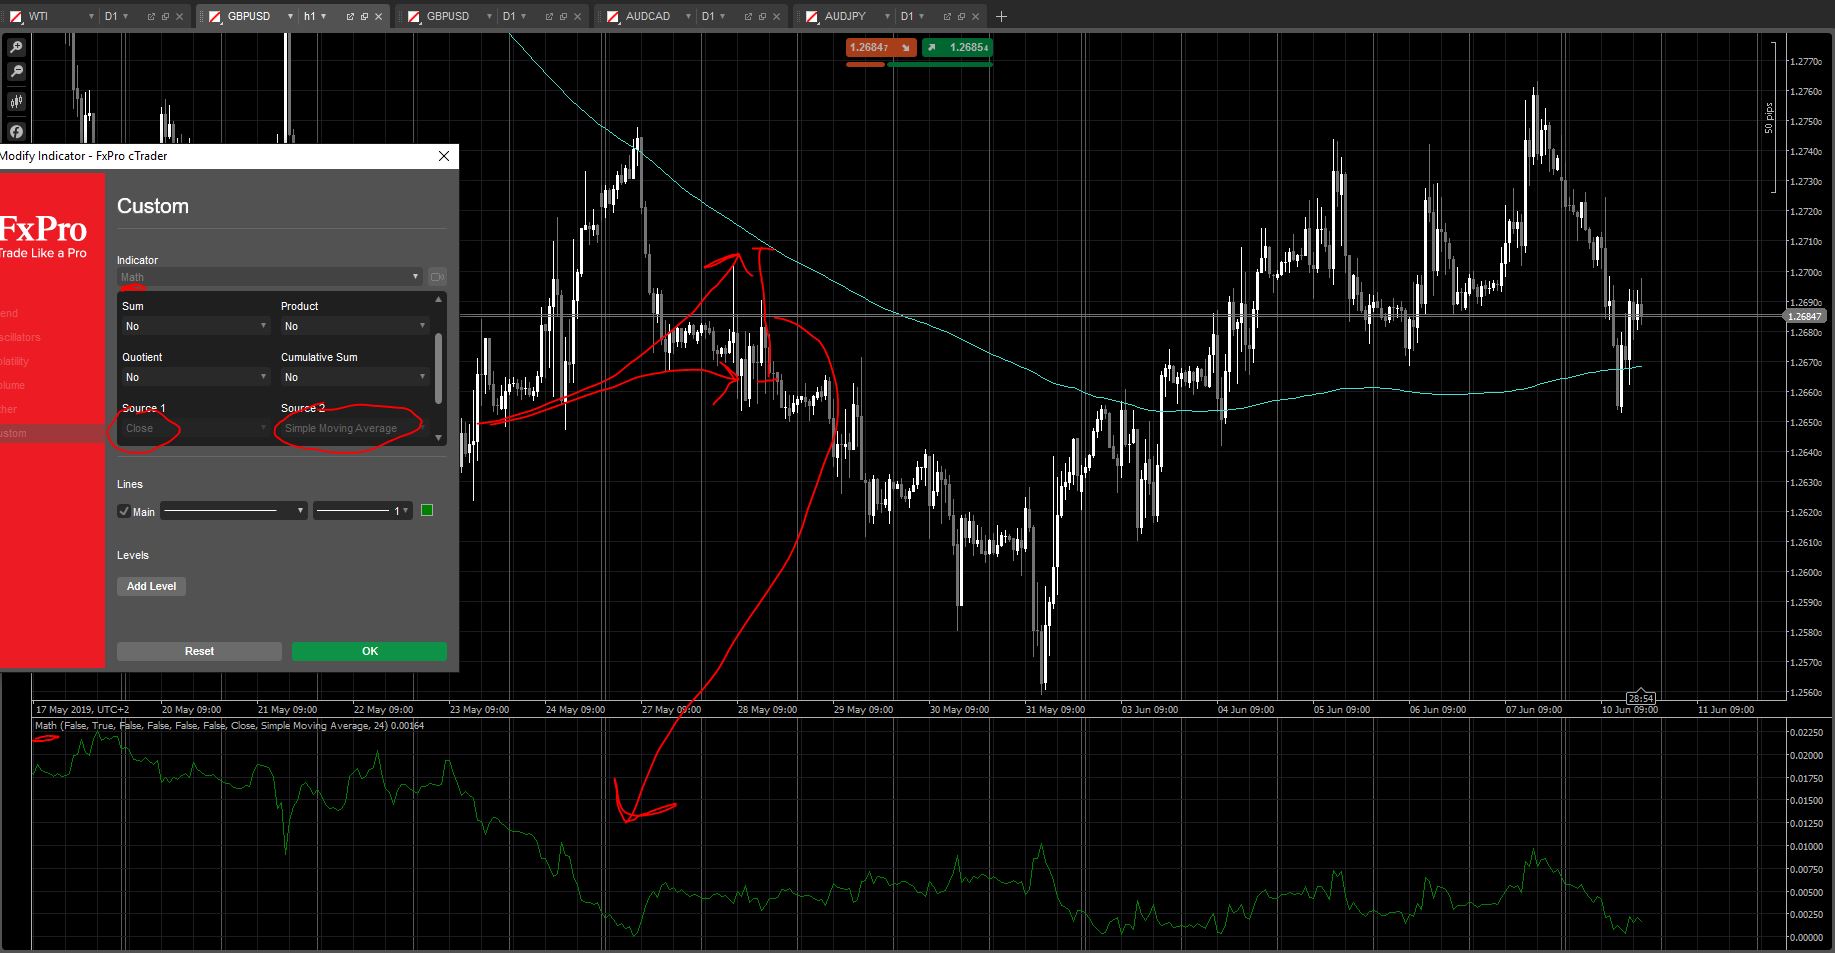 now I apply the Hourly Stagionality indicator and I ctrl + click and alt + click to set on the chart starting and ending points for the segment to analyze:
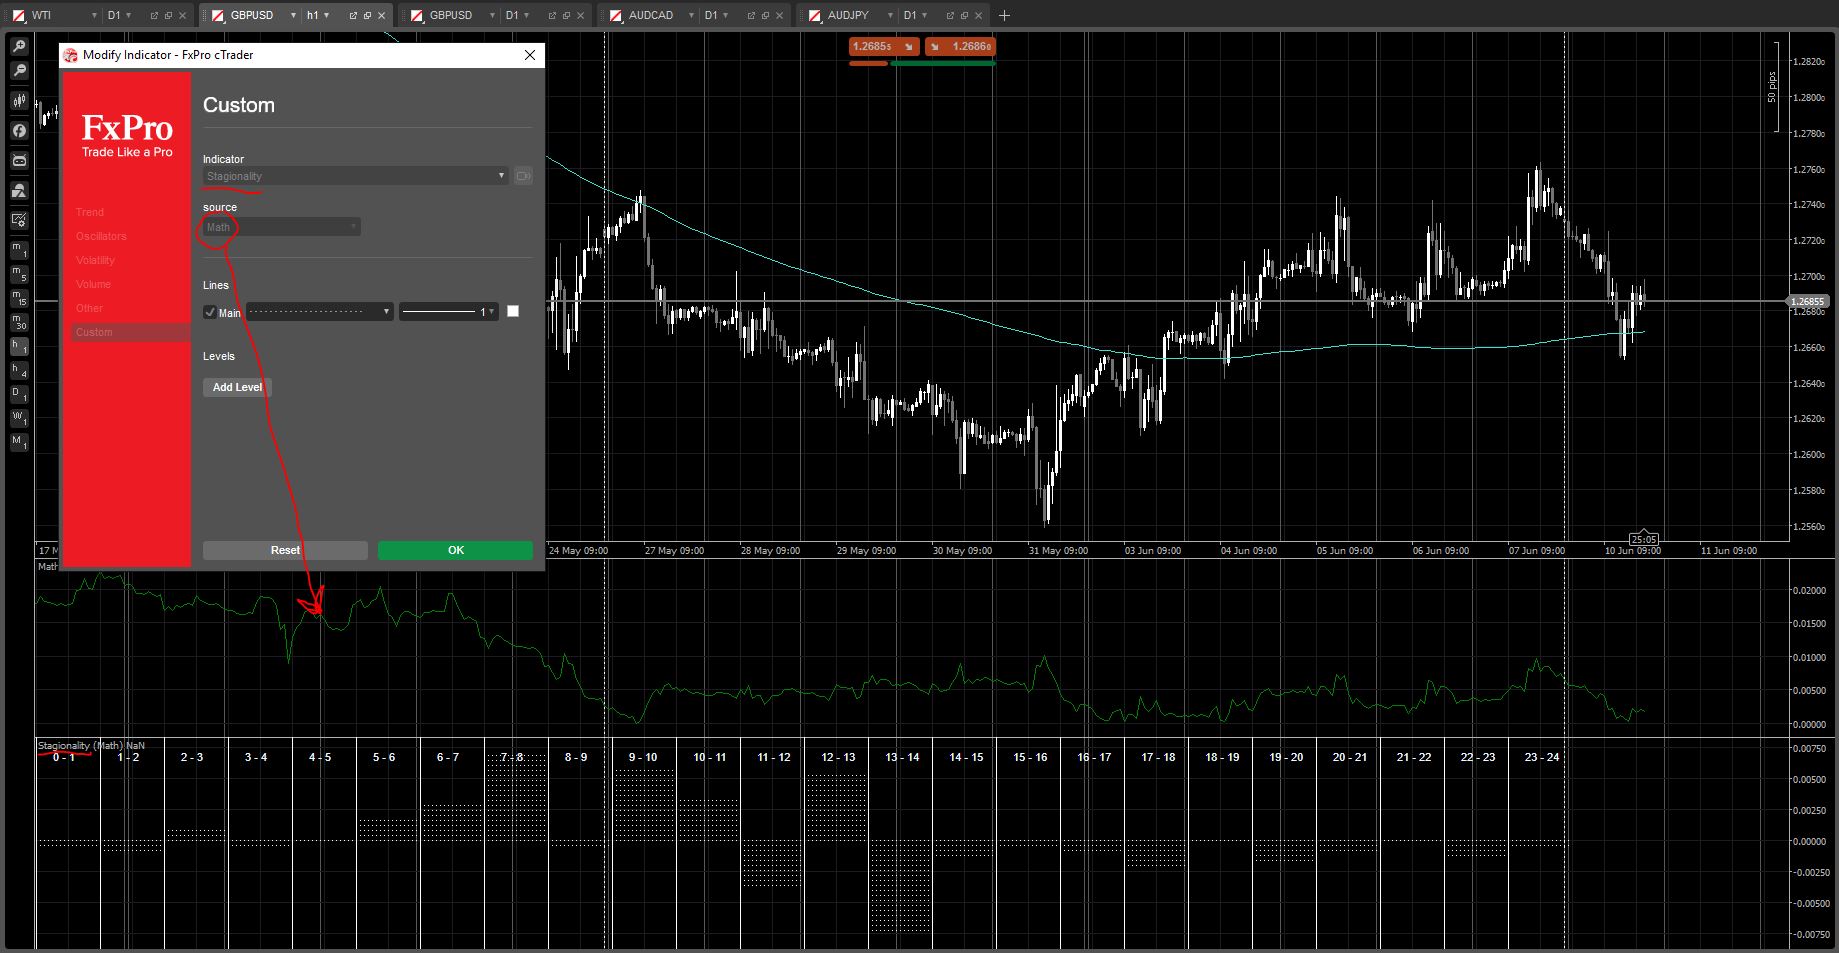 And here it is, all the data analyzen on an hourly basis from the selected start to the selected finish.
(Attention: TimeZone may be bugged, but most likely it isn't)
using System;
using cAlgo.API;
using cAlgo.API.Internals;
using cAlgo.API.Indicators;
using cAlgo.Indicators;
using System.Threading;

namespace cAlgo
{
    [Indicator(IsOverlay = false, TimeZone = TimeZones.UTC, AccessRights = AccessRights.None)]
    public class HourlyStagionality : Indicator
    {
        [Parameter()]
        public DataSeries source { get; set; }
        [Parameter("TimeZone", DefaultValue = 2)]
        public int tz { get; set; }

        [Output("Main", PlotType = PlotType.Histogram, Thickness = 1, Color = Colors.White, LineStyle = LineStyle.DotsRare)]
        public IndicatorDataSeries Result { get; set; }

        public int startIndex, endIndex;
        public bool ctrlClick = false, altClick = false;
        public bool mouseDown = false;

        protected override void Initialize()
        {
            Chart.MouseDown += OnChartMouseDown;
            Chart.ScrollChanged += OnChartScrollChanged;
            Chart.MouseUp += OnChartMouseUp;
        }

        void OnChartMouseUp(ChartMouseEventArgs obj)
        {
            if (ctrlClick && altClick)
                _Calculate(Chart.BarsTotal);
            mouseDown = false;
        }

        //alternative to the mouse-up refresh method
        void OnChartScrollChanged(ChartScrollEventArgs obj)
        {
            if (ctrlClick && altClick && !mouseDown)
                _Calculate(Chart.BarsTotal);
        }

        void OnChartMouseDown(ChartMouseEventArgs obj)
        {
            mouseDown = true;
            if (obj.CtrlKey && !obj.AltKey && !obj.ShiftKey)
            {
                startIndex = (int)obj.BarIndex;
                ctrlClick = true;
                Chart.DrawVerticalLine("start", startIndex, Color.White, 1, LineStyle.DotsRare);
            }
            else if (obj.AltKey && !obj.CtrlKey && !obj.ShiftKey)
            {
                endIndex = (int)obj.BarIndex;
                altClick = true;
                Chart.DrawVerticalLine("end", endIndex, Color.White, 1, LineStyle.DotsRare);
            }
            if ((obj.CtrlKey || obj.AltKey) && !obj.ShiftKey && ctrlClick && altClick)
                _Calculate(Chart.BarsTotal);
        }

        public override void Calculate(int index)
        {
        }

        public void _Calculate(int index)
        {
            for (int i = 0; i < index; i++)
            {
                Result[i] = double.NaN;
                //chart cleaning
            }

            double[] hours = new double[24];

            for (int i = startIndex; i < endIndex; i++)
            {
                int opentime = MarketSeries.OpenTime[i].AddHours(tz).Hour;
                //gathering the data
                hours[opentime] += source[i] - source[i - 1];
            }

            int nOfBars = Chart.LastVisibleBarIndex - Chart.FirstVisibleBarIndex;
            int segmentsWidth = nOfBars / 24;
            double hoursMax = 0;

            for (int i = 0; i < hours.Length; i++)
            {
                hoursMax = Math.Max(hoursMax, hours[i]);
            }

            //charting the data
            for (int i = 0; i < 24; i++)
            {
                IndicatorArea.DrawVerticalLine("zone" + i, Chart.FirstVisibleBarIndex + i * segmentsWidth, Color.White);
                for (int k = Chart.FirstVisibleBarIndex + i * segmentsWidth; k < Chart.FirstVisibleBarIndex + (i + 1) * segmentsWidth; k++)
                {
                    if (k - Chart.FirstVisibleBarIndex - i * segmentsWidth == Math.Ceiling((double)segmentsWidth / 2))
                    {
                        int X = Chart.FirstVisibleBarIndex + i * segmentsWidth + (k - Chart.FirstVisibleBarIndex - i * segmentsWidth) / 2;
                        IndicatorArea.DrawText("label" + i, i.ToString() + " - " + (i + 1).ToString(), X, hoursMax, Color.AliceBlue);
                    }
                    Result[k] = hours[i];
                }
            }
        }
    }
}
cysecsbin.01
Joined on 10.11.2018 Blocked
- Distribution: Free
- Language: C#
- Trading platform: cTrader Automate
- File name: Stagionality.algo
- Rating: 0
- Installs: 1509
- Modified: 13/10/2021 09:54
