Description
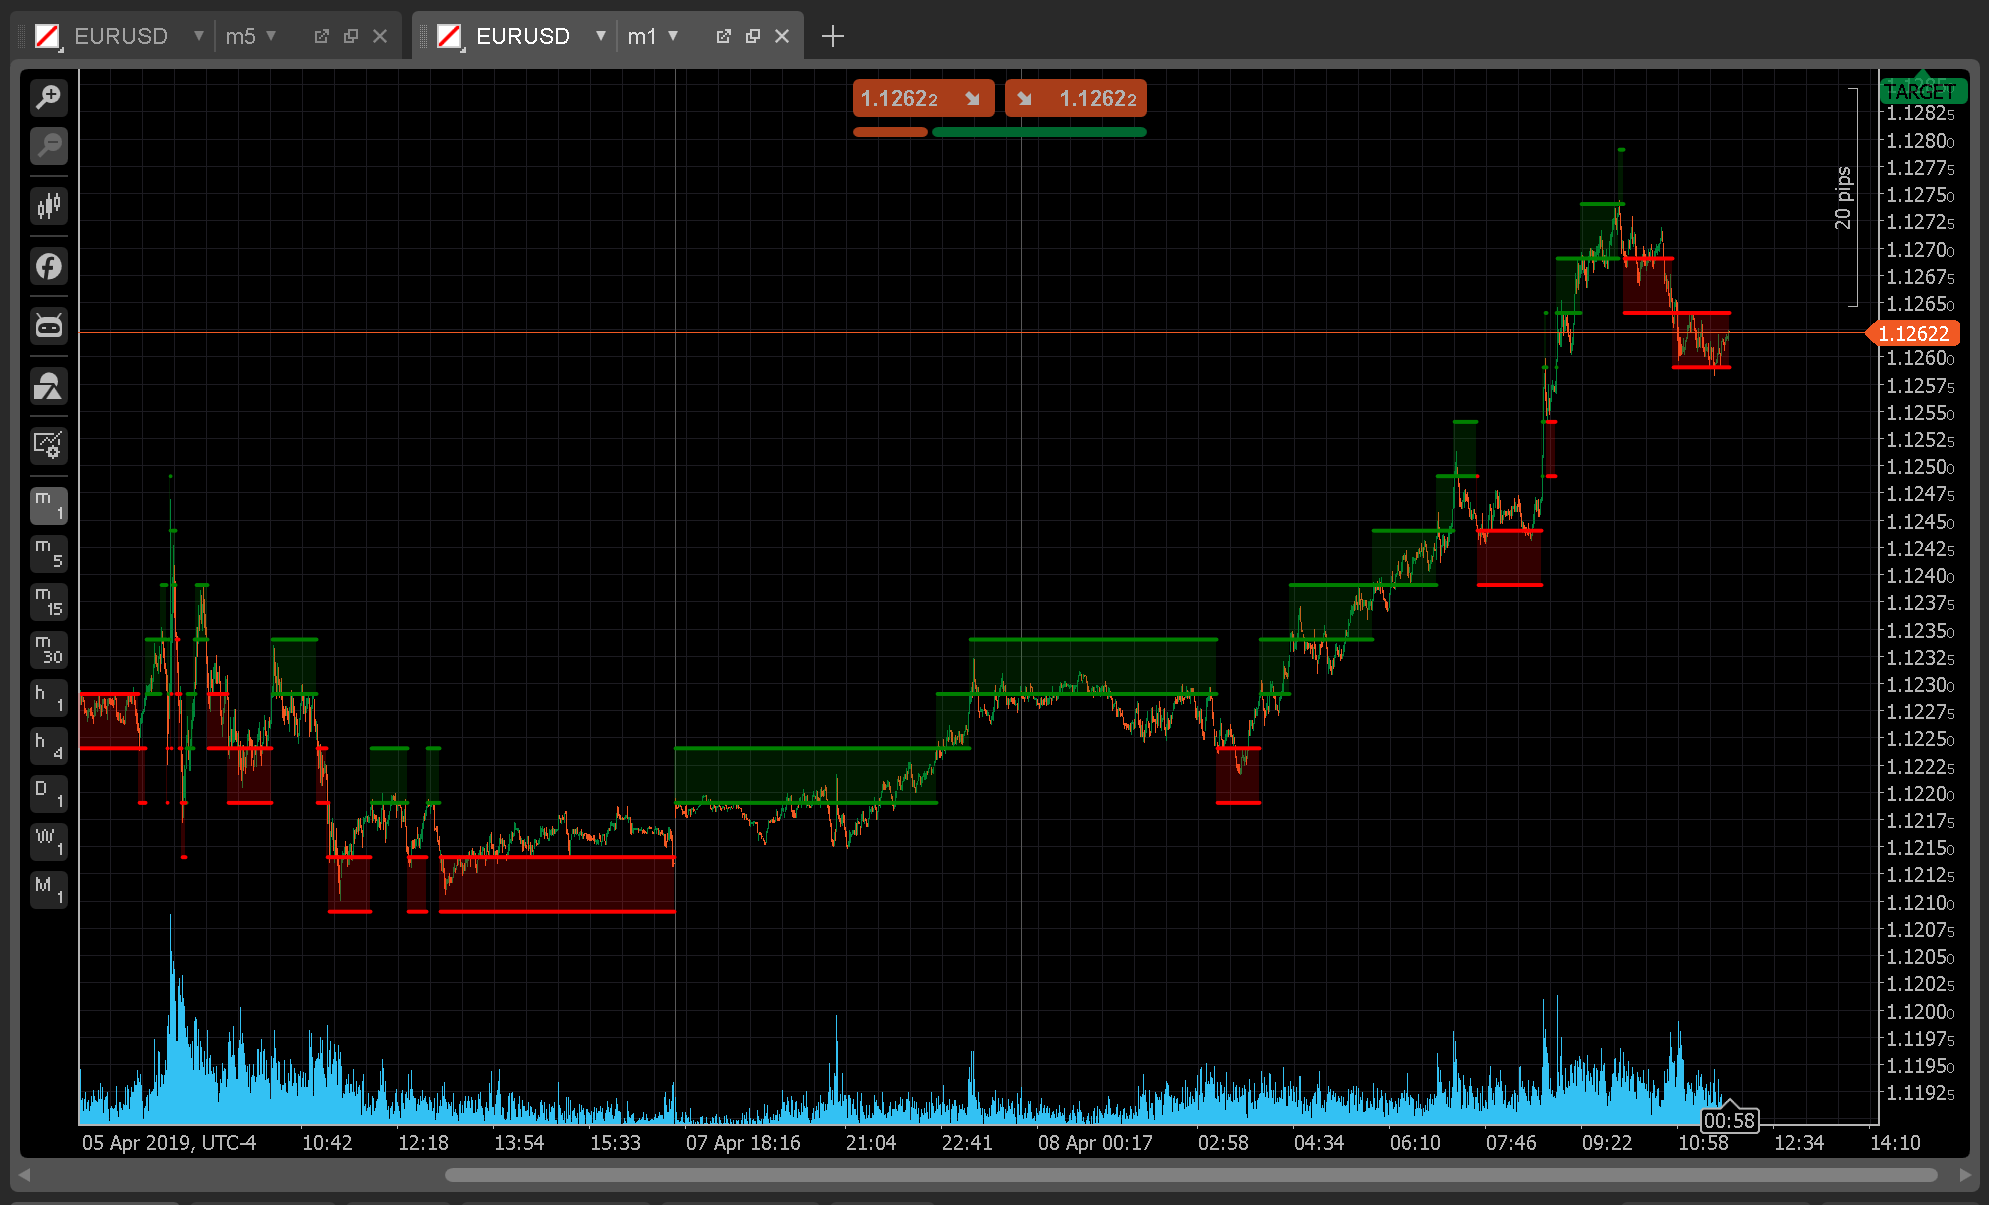
Renko chart is very powerful on trend analysis as renko chart filters noise. However, you can not see the detailed price movement inside each traditional renko brick. This indicator will plot renko chart on top of traditional chart. Therefore you will see the detailed price movement inside the renko brick. When price moves very fast, the renko brick is small, then price moves slow, the renko brick becomes big.
This indicator works best on small tick chart, range chart as well as small time frame of time chart.
Any question or suggestions, leave comments below.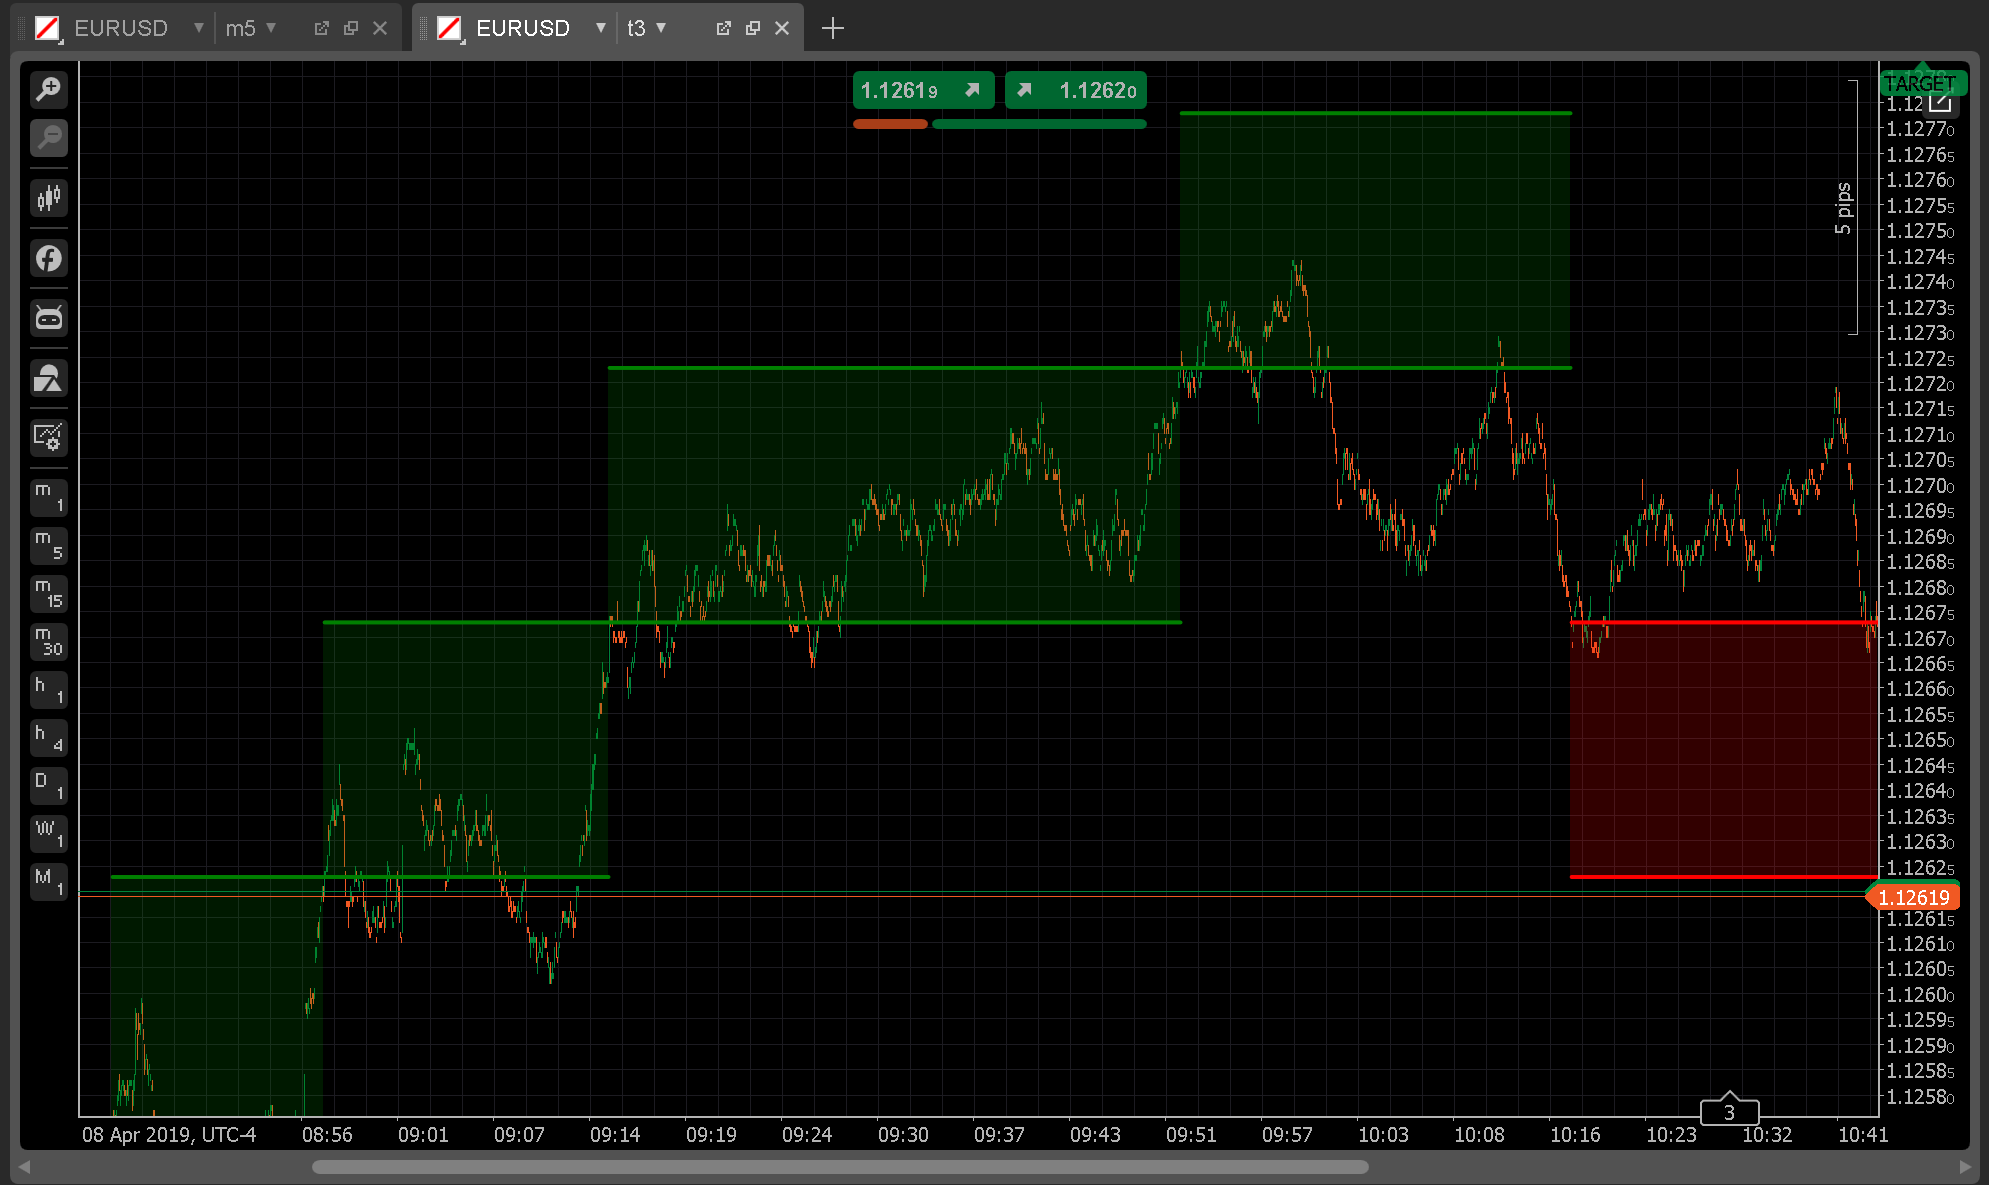
//Renko indicator on time chart
//Author: jumpycalm
//Last modified date: 20190408
using cAlgo.API;
using cAlgo.API.Internals;

namespace cAlgo.Indicators
{
    [Indicator(IsOverlay = true, TimeZone = TimeZones.UTC, AccessRights = AccessRights.None)]
    public class RenkoOnRangeChart : Indicator
    {
        [Parameter("Renko pip size", DefaultValue = 10, MinValue = 1, Step = 1)]
        public int RenkoPipSize { get; set; }

        [Output("Bullish upper band", LineColor = "Green", PlotType = PlotType.Points, Thickness = 3)]
        public IndicatorDataSeries BullishUpperBand { get; set; }

        [Output("Bullish lower band", LineColor = "Green", PlotType = PlotType.Points, Thickness = 3)]
        public IndicatorDataSeries BullishLowerBand { get; set; }

        [Output("Bearish upper band", LineColor = "Red", PlotType = PlotType.Points, Thickness = 3)]
        public IndicatorDataSeries BearishUpperBand { get; set; }

        [Output("Bearish lower band", LineColor = "Red", PlotType = PlotType.Points, Thickness = 3)]
        public IndicatorDataSeries BearishLowerBand { get; set; }

        [Parameter("Bullish rectangle color", DefaultValue = "Green")]
        public string BullishRectangleColor { get; set; }

        [Parameter("Bearish rectangle color", DefaultValue = "Red")]
        public string BearishRectangleColor { get; set; }

        [Parameter("Rectangle color transparency", DefaultValue = 50, MinValue = 1, Step = 1, MaxValue = 255)]
        public int RectangleColorTransparency { get; set; }

        private bool PreviousBull;
        private double RenkoEntryPrice;

        //Function to convert string color to color object
        public static Color GetColor(string colorString, int alpha = 255)
        {
            Color color = colorString[0] == '#' ? Color.FromHex(colorString) : Color.FromName(colorString);

            return Color.FromArgb(alpha, color);
        }

        protected override void Initialize()
        {
            //To be simple, first renko brick is always bullish brick
            PreviousBull = true;
            RenkoEntryPrice = MarketSeries.Low[0];
            BullishUpperBand[0] = MarketSeries.Low[0] + RenkoPipSize * Symbol.PipSize;
            BullishLowerBand[0] = MarketSeries.Low[0];
        }

        public override void Calculate(int index)
        {
            //Ignore processing the first one
            if (0 == index)
            {
                return;
            }

            //Case for previous brick is bullish brick
            if (true == PreviousBull)
            {
                //Case for bullish brick turns into bearish brick
                if (MarketSeries.Low[index] <= BullishLowerBand[index - 1] - RenkoPipSize * Symbol.PipSize)
                {
                    //Set bearish flag
                    PreviousBull = false;
                    //Check to see if need to throw warning
                    if (MarketSeries.High[index] >= BullishUpperBand[index - 1] + RenkoPipSize * Symbol.PipSize)
                    {
                        Chart.DrawStaticText("warning", "Warning! Change chart to a smaller time frame or use a larger renko pip size", VerticalAlignment.Top, HorizontalAlignment.Center, "Yellow");
                    }
                    //Case for current price smaller than renko entry price
                    if (MarketSeries.Low[index] < RenkoEntryPrice)
                    {
                        BearishUpperBand[index] = MarketSeries.Low[index] + (RenkoEntryPrice - MarketSeries.Low[index]) % (RenkoPipSize * Symbol.PipSize);
                        BearishLowerBand[index] = BearishUpperBand[index] - RenkoPipSize * Symbol.PipSize;
                        DrawRenkoBrick(BearishLowerBand[index], BearishUpperBand[index], index, PreviousBull);
                    }
                    //Case for current price larger than or equal to renko entry price
                    else
                    {
                        BearishLowerBand[index] = MarketSeries.Low[index] - (MarketSeries.Low[index] - RenkoEntryPrice) % (RenkoPipSize * Symbol.PipSize);
                        BearishUpperBand[index] = BearishLowerBand[index] + RenkoPipSize * Symbol.PipSize;
                        DrawRenkoBrick(BearishLowerBand[index], BearishUpperBand[index], index, PreviousBull);
                    }
                }
                //Case for next higher bullish brick
                else if (MarketSeries.High[index] > BullishUpperBand[index - 1])
                {
                    //Case for current price smaller than renko entry price
                    if (MarketSeries.High[index] < RenkoEntryPrice)
                    {
                        BullishUpperBand[index] = MarketSeries.High[index] + (RenkoEntryPrice - MarketSeries.High[index]) % (RenkoPipSize * Symbol.PipSize);
                        BullishLowerBand[index] = BullishUpperBand[index] - RenkoPipSize * Symbol.PipSize;
                        DrawRenkoBrick(BullishLowerBand[index], BullishUpperBand[index], index, PreviousBull);
                    }
                    //Case for current price larger than or equal to renko entry price
                    else
                    {
                        BullishLowerBand[index] = MarketSeries.High[index] - (MarketSeries.High[index] - RenkoEntryPrice) % (RenkoPipSize * Symbol.PipSize);
                        BullishUpperBand[index] = BullishLowerBand[index] + RenkoPipSize * Symbol.PipSize;
                        DrawRenkoBrick(BullishLowerBand[index], BullishUpperBand[index], index, PreviousBull);
                    }
                }
                //Case for same brick
                else
                {
                    BullishUpperBand[index] = BullishUpperBand[index - 1];
                    BullishLowerBand[index] = BullishLowerBand[index - 1];
                    DrawRenkoBrick(BullishLowerBand[index], BullishUpperBand[index], index, PreviousBull);
                }
            }

            //Case for previous brick is bearish brick
            else
            {
                //Case for bearish brick turns into bullish brick
                if (MarketSeries.High[index] >= BearishUpperBand[index - 1] + RenkoPipSize * Symbol.PipSize)
                {
                    //Set bullish flag
                    PreviousBull = true;
                    //Check to see if need to throw warning
                    if (MarketSeries.Low[index] <= BearishLowerBand[index - 1] + RenkoPipSize * Symbol.PipSize)
                    {
                        Chart.DrawStaticText("Warning", "Warning! Change chart to a smaller time frame or use a larger renko pip size", VerticalAlignment.Top, HorizontalAlignment.Center, "Yellow");
                    }
                    //Case for current price smaller than renko entry price
                    if (MarketSeries.Low[index] < RenkoEntryPrice)
                    {
                        BullishUpperBand[index] = MarketSeries.High[index] + (RenkoEntryPrice - MarketSeries.High[index]) % (RenkoPipSize * Symbol.PipSize);
                        BullishLowerBand[index] = BullishUpperBand[index] - RenkoPipSize * Symbol.PipSize;
                        DrawRenkoBrick(BullishLowerBand[index], BullishUpperBand[index], index, PreviousBull);
                    }
                    //Case for current price larger than or equal renko entry price
                    else
                    {
                        BullishLowerBand[index] = MarketSeries.High[index] - (MarketSeries.High[index] - RenkoEntryPrice) % (RenkoPipSize * Symbol.PipSize);
                        BullishUpperBand[index] = BullishLowerBand[index] + RenkoPipSize * Symbol.PipSize;
                        DrawRenkoBrick(BullishLowerBand[index], BullishUpperBand[index], index, PreviousBull);
                    }
                }
                //Case for next lower bearish brick
                else if (MarketSeries.Low[index] < BearishLowerBand[index - 1])
                {
                    //Case for current price smaller than renko entry price
                    if (MarketSeries.Low[index] < RenkoEntryPrice)
                    {
                        BearishUpperBand[index] = MarketSeries.Low[index] + (RenkoEntryPrice - MarketSeries.Low[index]) % (RenkoPipSize * Symbol.PipSize);
                        BearishLowerBand[index] = BearishUpperBand[index] - RenkoPipSize * Symbol.PipSize;
                        DrawRenkoBrick(BearishLowerBand[index], BearishUpperBand[index], index, PreviousBull);
                    }
                    //Case for current price larger than or equal to renko entry price
                    else
                    {
                        BearishLowerBand[index] = MarketSeries.High[index] - (MarketSeries.High[index] - RenkoEntryPrice) % (RenkoPipSize * Symbol.PipSize);
                        BearishUpperBand[index] = BearishLowerBand[index] + RenkoPipSize * Symbol.PipSize;
                        DrawRenkoBrick(BearishLowerBand[index], BearishUpperBand[index], index, PreviousBull);
                    }
                }
                //Case for same brick
                else
                {
                    BearishUpperBand[index] = BearishUpperBand[index - 1];
                    BearishLowerBand[index] = BearishLowerBand[index - 1];
                    DrawRenkoBrick(BearishLowerBand[index], BearishUpperBand[index], index, PreviousBull);
                }
            }
        }

        //Function to draw renko brick
        private void DrawRenkoBrick(double LowPrice, double HighPrice, int Idx, bool IsBull)
        {
            Color RecColor;
            if (IsBull)
            {
                RecColor = GetColor(BullishRectangleColor, RectangleColorTransparency);
            }
            else
            {
                RecColor = GetColor(BearishRectangleColor, RectangleColorTransparency);
            }
            ChartRectangle rectangle = Chart.DrawRectangle("rectangle " + Idx, Idx - 1, LowPrice, Idx, HighPrice, RecColor, 0);
            rectangle.IsFilled = true;
        }
    }
}

jumpycalm
Joined on 28.03.2019
- Distribution: Free
- Language: C#
- Trading platform: cTrader Automate
- File name: Renko on Range Chart.algo
- Rating: 5
- Installs: 3153
- Modified: 13/10/2021 09:55

Comments
Hello,
i prefer renko charts too. But i use them in another way.
http://fxpro.ctrader.com/c/MsJdn
http://fxpro.ctrader.com/c/SsJdn
i use the swings as Supply and demand areas. look picture. I use the supply and demand indicator by afhacker from algodeveloper.com (he is listet in ctdn).
My problem is i missuse his indicator. in candlestick chart i cannot see the zones. have to draw them manually. maybe you have an idear how to display only the turn arrounds?
greeds
afhacker did not post his code on the website, it's difficult to know how his indicator works. If you can find the source code for supply and demand, I may able to figure out and potentially integrate it with this indicator for better visualization.
Also, try range chart and tick chart, they are not time based.