Warning! This section will be deprecated on February 1st 2025. Please move all your Indicators to the cTrader Store catalogue.
Description
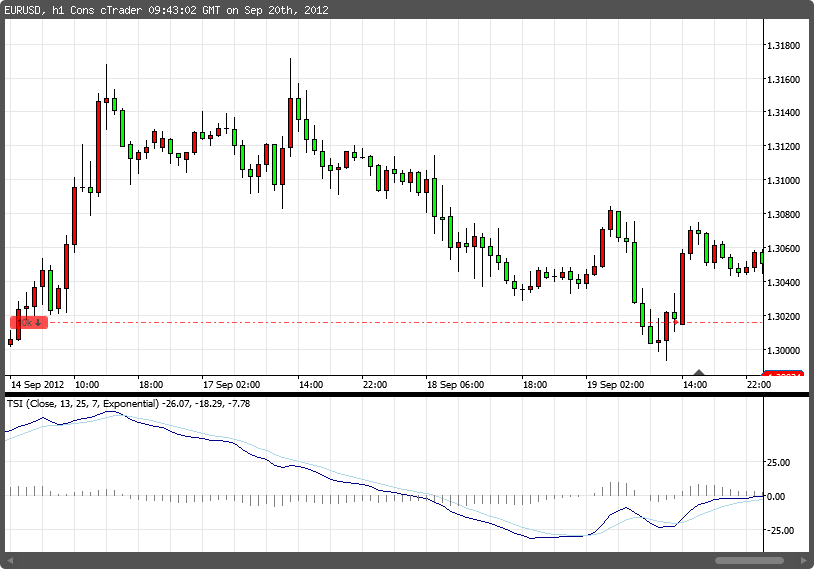
True Strength Index (TSI) developed by William Blau suggests that a trader may anticipate a market turn at overbought and oversold levels which are set at +25 and −25 , respectively. A rising TSI indicates an up-trend and a falling TSI indicates a down-trend.
u
MM
mmQuant
Joined on 19.09.2012
- Distribution: Free
- Language: C#
- Trading platform: cTrader Automate
- File name: TSI.algo
- Rating: 5
- Installs: 6007
- Modified: 13/10/2021 09:54

Note that publishing copyrighted material is strictly prohibited. If you believe there is copyrighted material in this section, please use the Copyright Infringement Notification form to submit a claim.
Comments
Log in to add a comment.
DI
This is such a strong indicator. Once that crossover happens on the signal line in the 4H chart it's unstoppable.
Thank you for uploading this mate.
It is literally just a MACD.. I mean literally. Download this and put it on a chart and then put a standard MACD crossover with default settings and you will see it is literally identical. Total fraud uploader and waste of everyone's time. Don't say I didn't warn you.