Description
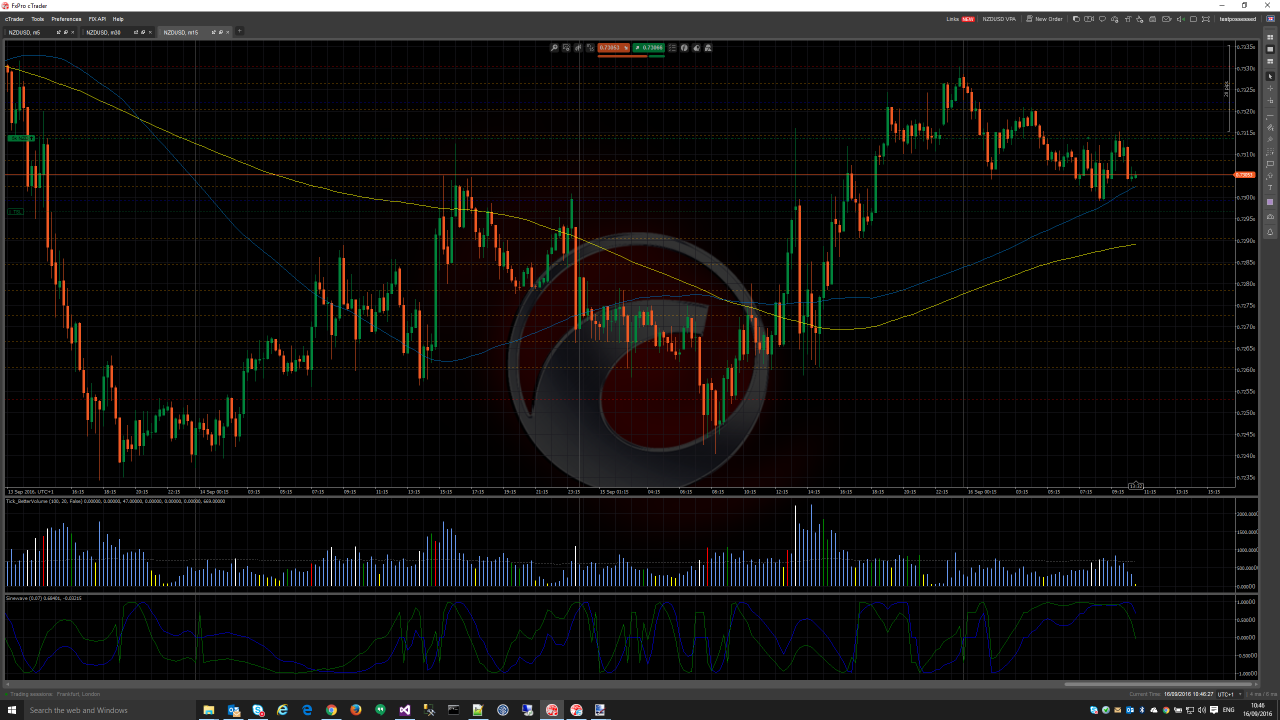
This indicator is an alternative to my Support And Resistance At Price indicator. It uses a different algorithm for drawing support and resistance lines. Basically it builds a set of SR Zones based on the parameters you specify then draws a line in the middle of the zone if price enters the zone without continuing. It provides the following parameters to support optimisation.
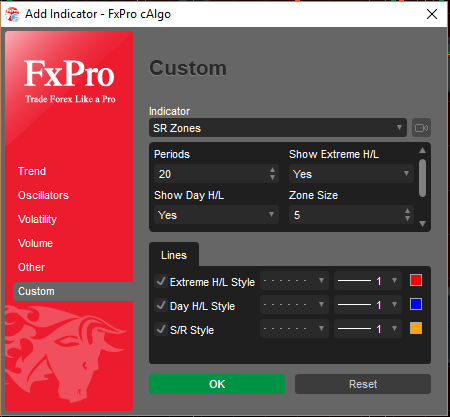
Parameters:
- Periods
- The number of periods to be analysed for support and resistance
- Show Extreme H/L
- Whether to render lines at the highest high and lowest low for the specified periods
- Defaults to true and rendering in Red
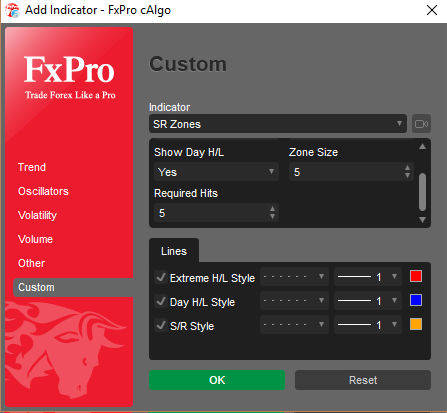
- Show Day H/L
- Whether to render lines at the highest high and lowest low for the date of the current period
- Defaults to true and rendering in Blue
- Only applies if the time frame is lower than Daily
- Zone Size
- Specified the number of pips to use as a Zone for limiting the number of lines drawn
- Defaults to 5
- Required Hits
- Specifies the number of times price must turn at a value to be considered support or resistance
- Defaults to 5
- Extreme H/L Style
- The line style and colour to be used for drawing the extreme high and low lines
- Day H/L Style
- The line style and colour to be used for drawing the high and low lines for the day
- S/R Style
- The line style and colour to be used for drawing support and resistance lines
Known Issue
I haven't been able to find a way to change line styles dynamically, colours aren't supported as parameters yet so I use an Output Attribute and get the settings from this, not ideal but it is the best option we have for now. The issue is that I can't detect when the style changes after the indicator is initialised. If you want to change the line styles after installing the indicator you need to remove it and add it again changing the lines styles before clicking OK
using System;
using System.Collections.Generic;
using cAlgo.API;
using cAlgo.API.Internals;
using cAlgo.API.Indicators;
using cAlgo.Indicators;

namespace cAlgo
{
    [Indicator("Support and Resistance Zones", IsOverlay = true, AccessRights = AccessRights.None)]
    public class SRZones : Indicator
    {
        private double extremeHigh = 0;
        private double extremeLow = 0;
        private double dayHi = 0;
        private double dayLo = 0;
        private IList<Zone> zones = new List<Zone>();

        private const string ExtremeHighName = "ExtremeHigh";
        private const string ExtremeLowName = "ExtremeLow";
        private const string DayHighName = "DayHigh";
        private const string DayLowName = "DayLow";

        [Parameter("Periods", DefaultValue = 100)]
        public int Periods { get; set; }

        [Parameter("Show Extreme H/L", DefaultValue = true)]
        public bool ShowExtremeHL { get; set; }

        [Parameter("Show Day H/L", DefaultValue = true)]
        public bool ShowDayHL { get; set; }

        [Parameter("Zone Size", DefaultValue = 5)]
        public int ZoneSize { get; set; }

        [Parameter("Required Hits", DefaultValue = 5)]
        public int RequiredHits { get; set; }

        [Output("Extreme H/L Style", Color = Colors.Red, LineStyle = LineStyle.DotsVeryRare)]
        public IndicatorDataSeries ExtremeHLStyle { get; set; }

        [Output("Day H/L Style", Color = Colors.Blue, LineStyle = LineStyle.DotsVeryRare)]
        public IndicatorDataSeries DayHLStyle { get; set; }

        [Output("S/R Style", Color = Colors.Orange, LineStyle = LineStyle.DotsVeryRare)]
        public IndicatorDataSeries SRStyle { get; set; }

        public override void Calculate(int index)
        {
            if (this.IsLastBar)
            {
                var currentOpenDate = this.MarketSeries.OpenTime[index].Date;
                var earliest = index - this.Periods;
                for (var i = index; i >= earliest; i--)
                {
                    if (i >= 0)
                    {
                        var high = this.MarketSeries.High[i];
                        var low = this.MarketSeries.Low[i];
                        this.extremeHigh = Math.Max(high, this.extremeHigh);
                        this.extremeLow = this.extremeLow == 0 ? low : Math.Min(low, this.extremeLow);

                        if (this.TimeFrame < TimeFrame.Daily)
                        {
                            if (this.MarketSeries.OpenTime[i].Date == currentOpenDate)
                            {
                                this.dayHi = Math.Max(high, this.dayHi);
                                this.dayLo = this.dayLo == 0 ? low : Math.Min(low, this.dayLo);
                            }
                        }
                    }
                    else
                    {
                        break;
                    }
                }

                this.zones.Clear();
                var zonePipSize = (this.Symbol.PipSize * (double)this.ZoneSize);
                for (var i = this.extremeLow + zonePipSize; i < this.extremeHigh - zonePipSize; i += zonePipSize + this.Symbol.PipSize)
                {
                    this.zones.Add(new Zone
                    {
                        Start = i,
                        End = i + zonePipSize,
                        Count = 0
                    });
                }

                for (var i = index; i >= earliest; i--)
                {
                    if (i >= 0)
                    {
                        var high = this.MarketSeries.High[i];
                        var nextHigh = this.MarketSeries.High[i + 1];
                        var low = this.MarketSeries.Low[i];
                        var nextLow = this.MarketSeries.Low[i + 1];
                        for (var z = 0; z < this.zones.Count; z++)
                        {
                            var zone = this.zones[z];
                            if ((nextHigh <= zone.End && high >= zone.Start && high <= zone.End) || (nextLow >= zone.Start && low >= zone.Start && low <= zone.End))
                            {
                                zone.Count++;
                            }
                        }
                    }
                    else
                    {
                        break;
                    }
                }

                this.ChartObjects.RemoveAllObjects();

                foreach (var zone in this.zones)
                {
                    if (zone.Count >= this.RequiredHits)
                    {
                        this.DrawSR(zone.Middle);
                    }
                }

                if (this.ShowExtremeHL)
                {
                    this.DrawExtremeHigh();
                    this.DrawExtremeLow();
                }

                if (this.TimeFrame < TimeFrame.Daily && this.ShowDayHL)
                {
                    this.DrawDayHigh();
                    this.DrawDayLow();
                }
            }
        }

        private void DrawExtremeHigh()
        {
            this.DrawExtreme(ExtremeHighName, this.extremeHigh);
        }

        private void DrawExtremeLow()
        {
            this.DrawExtreme(ExtremeLowName, this.extremeLow);
        }

        private void DrawDayHigh()
        {
            this.DrawDay(DayHighName, this.dayHi);
        }

        private void DrawDayLow()
        {
            this.DrawDay(DayLowName, this.dayLo);
        }

        private void DrawExtreme(string name, double level)
        {
            var attribute = this.GetAttributeFrom<OutputAttribute>("ExtremeHLStyle");
            this.ChartObjects.DrawHorizontalLine(name, level, attribute.Color, attribute.Thickness, attribute.LineStyle);
        }

        private void DrawDay(string name, double level)
        {
            var attribute = this.GetAttributeFrom<OutputAttribute>("DayHLStyle");
            this.ChartObjects.DrawHorizontalLine(name, level, attribute.Color, attribute.Thickness, attribute.LineStyle);
        }

        private void DrawSR(double level)
        {
            var attribute = this.GetAttributeFrom<OutputAttribute>("SRStyle");
            this.ChartObjects.DrawHorizontalLine(string.Format("SR {0}", level), level, attribute.Color, attribute.Thickness, attribute.LineStyle);
        }

        private T GetAttributeFrom<T>(string propertyName)
        {
            var attrType = typeof(T);
            var property = this.GetType().GetProperty(propertyName);
            return (T)property.GetCustomAttributes(attrType, false).GetValue(0);
        }

        private class Zone
        {
            internal double Start { get; set; }
            internal double End { get; set; }
            internal int Count { get; set; }
            internal double Middle
            {
                get { return this.Start + ((this.End - this.Start) / 2); }
            }
        }
    }
}
cTKit
Joined on 15.09.2016
- Distribution: Free
- Language: C#
- Trading platform: cTrader Automate
- File name: SR Zones.algo
- Rating: 5
- Installs: 11303
- Modified: 13/10/2021 09:54

Comments
It is a really very useful indicator. Have you something new or improved?
Can you help me on how to make reference to this indicator in a cbot so that the stop loss or take profit of the orders executed through the bot coincide with the levels in this indicator?
Or the bot automatically executes a buy or sell market order when price hits the levels indicated in this indicator? Please advise. Thanks.