Description
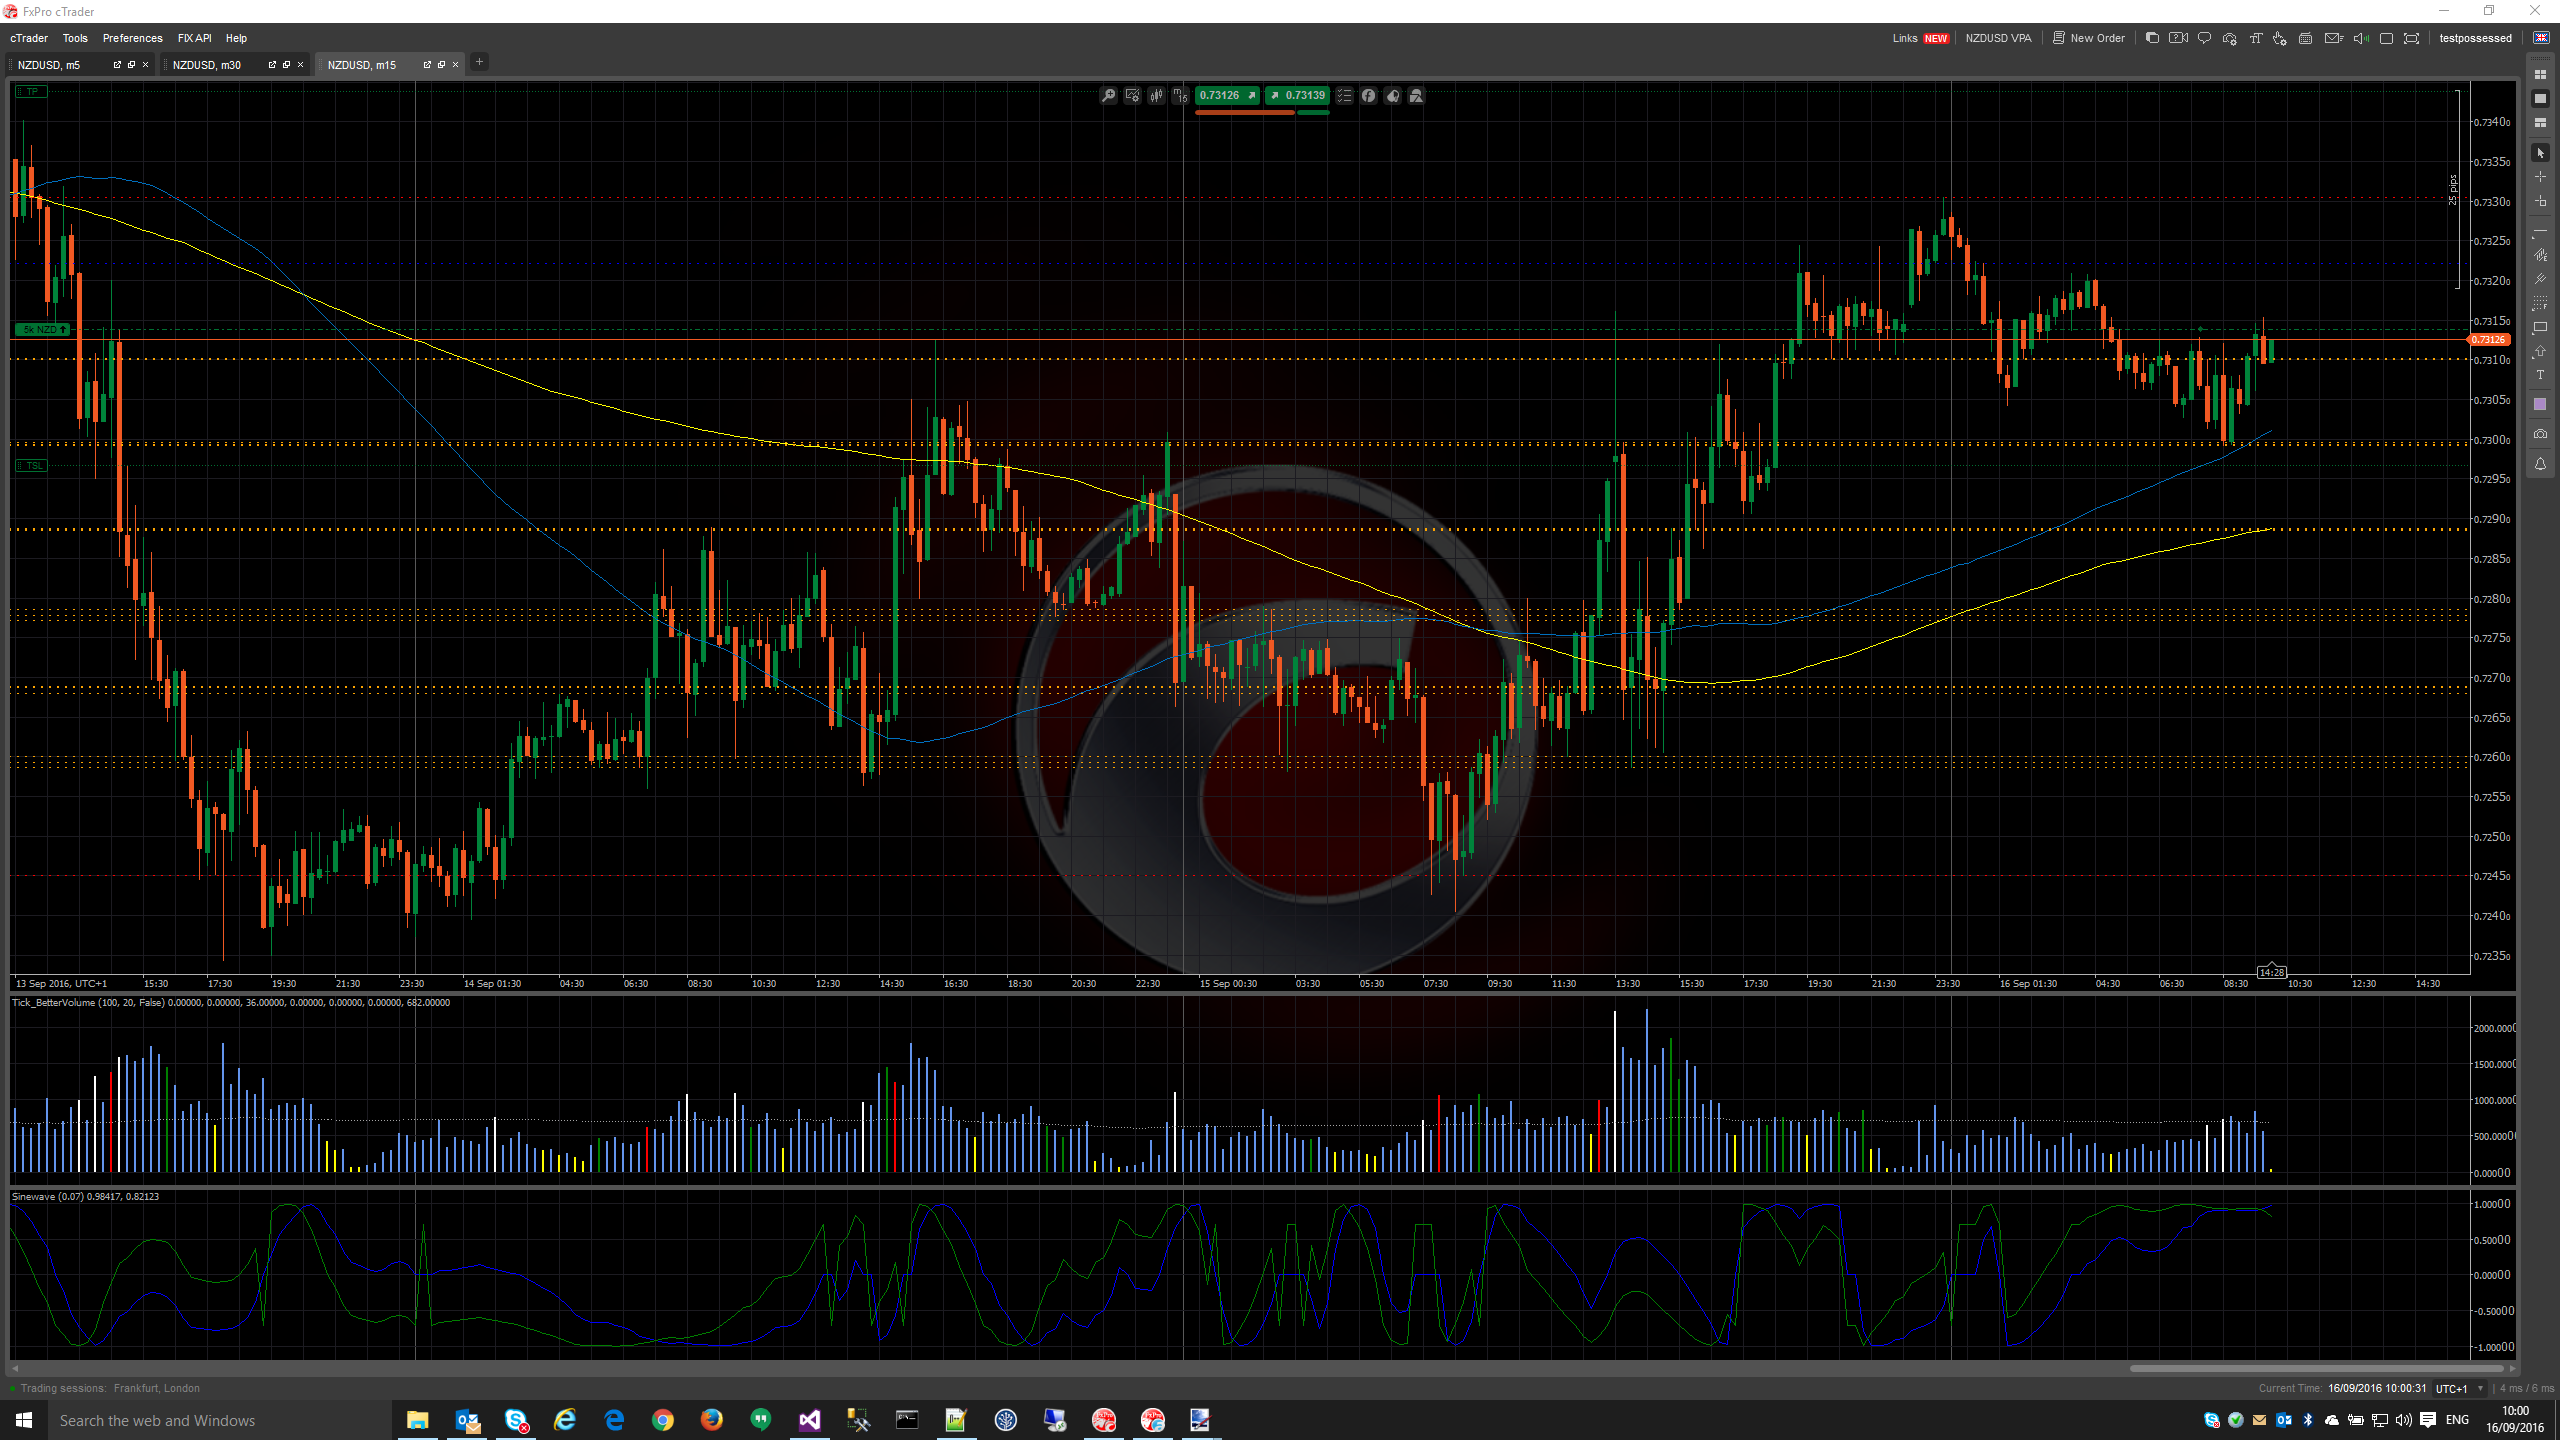
Inspired by an indicator sold by Quantum Trading for platforms other than cTrader this indicator draws support and resistance lines at specific prices in a way that allows you to see the strength of SR Zones. It works for any time frame and for a specific number of periods. It provides the following parameters to support optimisation.
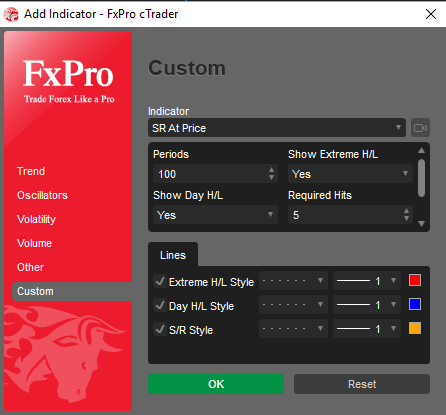
Parameters:
- Periods
- The number of periods to be analysed for support and resistance
- Show Extreme H/L
- Whether to render lines at the highest high and lowest low for the specified periods
- Defaults to true and rendering in Red
- Show Day H/L
- Whether to render lines at the highest high and lowest low for the date of the current period
- Defaults to true and rendering in Blue
- Only applies if the time frame is lower than Daily
- Required Hits
- Specifies the number of times price must turn at a value to be considered support or resistance
- Defaults to 5
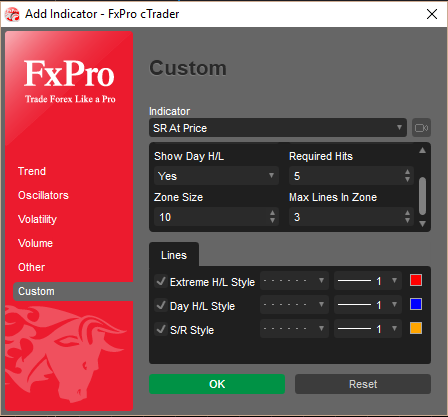
- Zone Size
- Specified the number of pips to use as a Zone for limiting the number of lines drawn
- Defaults to 10
- Max Lines Per Zone
- Specifies the maximum number of lines that will be drawn within a Zone specified by Zone Size
- Defaults to 3
- This allows you to avoid having too many lines too close together, whilst providing some indication of how strong the support and resistance is within a Zone
- Extreme H/L Style
- The line style and colour to be used for drawing the extreme high and low lines
- Day H/L Style
- The line style and colour to be used for drawing the high and low lines for the day
- S/R Style
- The line style and colour to be used for drawing support and resistance lines
Known Issue
I haven't been able to find a way to change line styles dynamically, colours aren't supported as parameters yet so I use an Output Attribute and get the settings from this, not ideal but it is the best option we have for now. The issue is that I can't detect when the style changes after the indicator is initialised. If you want to change the line styles after installing the indicator you need to remove it and add it again changing the lines styles before clicking OK
using System;
using System.Collections.Generic;
using cAlgo.API;
using cAlgo.API.Internals;
using cAlgo.API.Indicators;
using cAlgo.Indicators;

namespace cAlgo
{
    [Indicator("Support and Resistance At Price", IsOverlay = true, AccessRights = AccessRights.None)]
    public class SRAtPrice : Indicator
    {
        private double extremeHigh = 0;
        private double extremeLow = 0;
        private double dayHi = 0;
        private double dayLo = 0;
        private SortedList<double, int> prices = new SortedList<double, int>();
        private IList<Zone> zones = new List<Zone>();

        private const string ExtremeHighName = "ExtremeHigh";
        private const string ExtremeLowName = "ExtremeLow";
        private const string DayHighName = "DayHigh";
        private const string DayLowName = "DayLow";

        [Parameter("Periods", DefaultValue = 100)]
        public int Periods { get; set; }

        [Parameter("Show Extreme H/L", DefaultValue = true)]
        public bool ShowExtremeHL { get; set; }

        [Parameter("Show Day H/L", DefaultValue = true)]
        public bool ShowDayHL { get; set; }

        [Parameter("Required Hits", DefaultValue = 5)]
        public int RequiredHits { get; set; }

        [Parameter("Zone Size", DefaultValue = 10)]
        public int ZoneSize { get; set; }

        [Parameter("Max Lines In Zone", DefaultValue = 3)]
        public int MaxLinesInZone { get; set; }

        [Output("Extreme H/L Style", Color = Colors.Red, LineStyle = LineStyle.DotsVeryRare)]
        public IndicatorDataSeries ExtremeHLStyle { get; set; }

        [Output("Day H/L Style", Color = Colors.Blue, LineStyle = LineStyle.DotsVeryRare)]
        public IndicatorDataSeries DayHLStyle { get; set; }

        [Output("S/R Style", Color = Colors.Orange, LineStyle = LineStyle.DotsVeryRare)]
        public IndicatorDataSeries SRStyle { get; set; }

        public override void Calculate(int index)
        {
            if (this.IsLastBar)
            {
                var currentOpenDate = this.MarketSeries.OpenTime[index].Date;
                var earliest = index - this.Periods;
                for (var i = index; i >= earliest; i--)
                {
                    if (i >= 0)
                    {
                        var high = this.MarketSeries.High[i];
                        var nextHigh = this.MarketSeries.High[i + 1];
                        var low = this.MarketSeries.Low[i];
                        var nextLow = this.MarketSeries.Low[i + 1];
                        this.extremeHigh = Math.Max(high, this.extremeHigh);
                        this.extremeLow = this.extremeLow == 0 ? low : Math.Min(low, this.extremeLow);

                        if (this.TimeFrame < TimeFrame.Daily)
                        {
                            if (this.MarketSeries.OpenTime[i].Date == currentOpenDate)
                            {
                                this.dayHi = Math.Max(high, this.dayHi);
                                this.dayLo = this.dayLo == 0 ? low : Math.Min(low, this.dayLo);
                            }
                        }

                        if (nextHigh <= high)
                        {
                            this.AddOrUpdatePrice(high);
                        }

                        if (nextLow >= low)
                        {
                            this.AddOrUpdatePrice(low);
                        }
                    }
                    else
                    {
                        break;
                    }
                }

                this.zones.Clear();
                var rangePipSize = (this.Symbol.PipSize * (double)this.ZoneSize);
                for (var i = this.extremeLow + rangePipSize; i < this.extremeHigh - rangePipSize; i += rangePipSize + this.Symbol.PipSize)
                {
                    this.zones.Add(new Zone
                    {
                        Start = i,
                        End = i + rangePipSize,
                        LinesRendered = 0
                    });
                }

                this.ChartObjects.RemoveAllObjects();

                foreach (var price in this.prices.Keys)
                {
                    this.RenderSRIfRequred(price, this.prices[price]);
                }

                if (this.ShowExtremeHL)
                {
                    this.DrawExtremeHigh();
                    this.DrawExtremeLow();
                }

                if (this.TimeFrame < TimeFrame.Daily && this.ShowDayHL)
                {
                    this.DrawDayHigh();
                    this.DrawDayLow();
                }
            }
        }

        private void RenderSRIfRequred(double price, int count)
        {
            if (count < this.RequiredHits)
            {
                return;
            }

            foreach (var range in this.zones)
            {
                if (price >= range.Start && price <= range.End)
                {
                    if (range.LinesRendered != this.MaxLinesInZone)
                    {
                        range.LinesRendered++;
                        this.DrawSR(price);
                    }
                    return;
                }
            }
        }

        private void AddOrUpdatePrice(double priceValue)
        {
            if (this.prices.ContainsKey(priceValue))
            {
                this.prices[priceValue]++;
            }
            else
            {
                this.prices.Add(priceValue, 1);
            }
        }

        private void DrawExtremeHigh()
        {
            this.DrawExtreme(ExtremeHighName, this.extremeHigh);
        }

        private void DrawExtremeLow()
        {
            this.DrawExtreme(ExtremeLowName, this.extremeLow);
        }

        private void DrawDayHigh()
        {
            this.DrawDay(DayHighName, this.dayHi);
        }

        private void DrawDayLow()
        {
            this.DrawDay(DayLowName, this.dayLo);
        }

        private void DrawExtreme(string name, double level)
        {
            var attribute = this.GetAttributeFrom<OutputAttribute>("ExtremeHLStyle");
            this.ChartObjects.DrawHorizontalLine(name, level, attribute.Color, attribute.Thickness, attribute.LineStyle);
        }

        private void DrawDay(string name, double level)
        {
            var attribute = this.GetAttributeFrom<OutputAttribute>("DayHLStyle");
            this.ChartObjects.DrawHorizontalLine(name, level, attribute.Color, attribute.Thickness, attribute.LineStyle);
        }

        private void DrawSR(double level)
        {
            var attribute = this.GetAttributeFrom<OutputAttribute>("SRStyle");
            this.ChartObjects.DrawHorizontalLine(string.Format("SR {0}", level), level, attribute.Color, attribute.Thickness, attribute.LineStyle);
        }

        private T GetAttributeFrom<T>(string propertyName)
        {
            var attrType = typeof(T);
            var property = this.GetType().GetProperty(propertyName);
            return (T)property.GetCustomAttributes(attrType, false).GetValue(0);
        }

        private class Price
        {
            internal double Value { get; set; }
            internal int Count { get; set; }
        }

        private class Zone
        {
            internal double Start { get; set; }
            internal double End { get; set; }
            internal int LinesRendered { get; set; }
        }
    }
}
cTKit
Joined on 15.09.2016
- Distribution: Free
- Language: C#
- Trading platform: cTrader Automate
- File name: SR At Price.algo
- Rating: 0
- Installs: 12600
- Modified: 13/10/2021 09:54

Comments
Sorry for those who downloaded the first upload, I had forgotten to build it with the latest source code after a few changes.
Hello, I am trying to create a bot that sets the stop loss or take profit of the bots to coincide with the levels indicated in this indicator of yours. Would you be able to help me? Is that possible?
You may refer to this thread for details.