Description
Description:
This indicator is based on a strategy mentioned in John Carter's book, Mastering the Trade. The basic idea behind the strategy is that markets tend to move from periods of low volatility to high volatility and vice versa. The strategy aims to capture moves from low to high volatility.
For gauging this he uses two common indicators - Bollinger Bands and Keltner Channels. He also uses the Momentum indicator to provide a trade bias as some as the Bollinger Bands come back outside the Keltner Channels. The Squeeze Break indicator combines this into a signal indicator and has the following components:
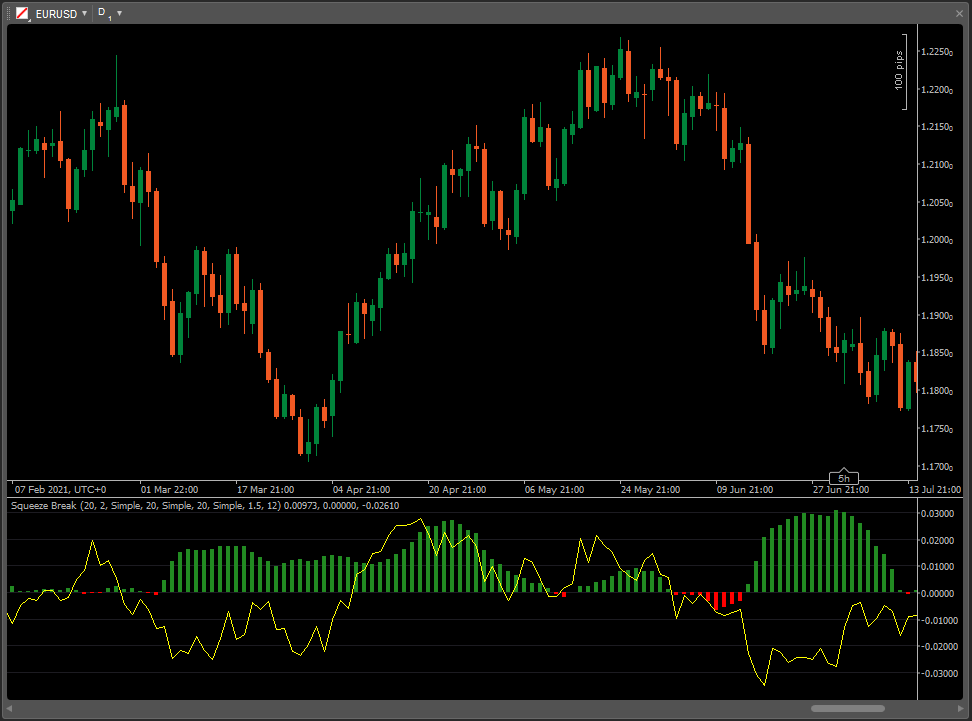
- A positive Green histogram means that the Bollinger Bands are outside the Keltner Channels and the market is lightly to be trending or volatile. The stronger the histogram the stronger the directional price move.
- A negative Red histogram means that the Bollinger Bands are inside the Keltner Channels and the market is lightly to be consolidating. The stronger the red histogram the tighter price action is becoming.
- Incorporated into the indicator is a Momentum indicator. According to the strategy J. Carter goes long when the Bollinger Bands break outside the Keltner Bands and the Momentum indicator is above the zero line. He goes short when the Momentum indicator is below the zero line.
- This indicator tends to be better with the larger timeframes.
This indicator based on MetaTrader 4 and it has been rewrote for cTrader.
Screenshots:
Github: GitHub - Doustzadeh/cTrader-Indicator
using System;
using cAlgo.API;
using cAlgo.API.Indicators;

namespace cAlgo
{
    [Indicator(IsOverlay = false, AccessRights = AccessRights.None)]
    public class SqueezeBreak : Indicator
    {
        [Parameter("Periods", Group = "Bollinger Bands", DefaultValue = 20)]
        public int BollingerPeriod { get; set; }

        [Parameter("Standard Dev", Group = "Bollinger Bands", DefaultValue = 2, MinValue = 0)]
        public double StDeviation { get; set; }

        [Parameter("MA Type", Group = "Bollinger Bands", DefaultValue = MovingAverageType.Simple)]
        public MovingAverageType BollingerMaType { get; set; }

        [Parameter("MA Period", Group = "Keltner Channels", DefaultValue = 20)]
        public int KeltnerPeriod { get; set; }

        [Parameter("MA Type", Group = "Keltner Channels", DefaultValue = MovingAverageType.Simple)]
        public MovingAverageType KeltnerMaType { get; set; }

        [Parameter("ATR Period", Group = "Keltner Channels", DefaultValue = 20)]
        public int AtrPeriods { get; set; }

        [Parameter("ATR MA Type", Group = "Keltner Channels", DefaultValue = MovingAverageType.Simple)]
        public MovingAverageType AtrMaType { get; set; }

        [Parameter("BandDistance", Group = "Keltner Channels", DefaultValue = 1.5)]
        public double BandDistance { get; set; }

        [Parameter("Momentum Periods", DefaultValue = 12)]
        public int MomentumPeriods { get; set; }

        [Output("Up", LineColor = "ForestGreen", PlotType = PlotType.Histogram, Thickness = 4)]
        public IndicatorDataSeries Up { get; set; }

        [Output("Down", LineColor = "Red", PlotType = PlotType.Histogram, Thickness = 4)]
        public IndicatorDataSeries Down { get; set; }

        [Output("Momentum", LineColor = "Yellow", LineStyle = LineStyle.Solid, Thickness = 1)]
        public IndicatorDataSeries Momentum { get; set; }

        private BollingerBands BbInd;
        private KeltnerChannels KcInd;

        private double KeltnerUp;
        private double KeltnerDown;
        private double BollingerUp;
        private double BollingerDown;

        protected override void Initialize()
        {
            BbInd = Indicators.BollingerBands(Bars.ClosePrices, BollingerPeriod, StDeviation, BollingerMaType);
            KcInd = Indicators.KeltnerChannels(KeltnerPeriod, KeltnerMaType, AtrPeriods, AtrMaType, BandDistance);
        }

        public override void Calculate(int index)
        {
            BollingerUp = BbInd.Top[index];
            BollingerDown = BbInd.Bottom[index];
            KeltnerUp = KcInd.Top[index];
            KeltnerDown = KcInd.Bottom[index];

            Momentum[index] = Bars.ClosePrices[index] - Bars.ClosePrices[index - MomentumPeriods];

            if (BollingerUp >= KeltnerUp || BollingerDown <= KeltnerDown)
            {
                Up[index] = Math.Abs(BollingerUp - KeltnerUp) + Math.Abs(BollingerDown - KeltnerDown);
            }
            else
            {
                Up[index] = 0;
            }

            if (BollingerUp < KeltnerUp && BollingerDown > KeltnerDown)
            {
                Down[index] = -(Math.Abs(BollingerUp - KeltnerUp) + Math.Abs(BollingerDown - KeltnerDown));
            }
            else
            {
                Down[index] = 0;
            }
        }

    }
}

Doustzadeh
Joined on 20.03.2016
- Distribution: Free
- Language: C#
- Trading platform: cTrader Automate
- File name: Squeeze Break.algo
- Rating: 0
- Installs: 4491
- Modified: 13/11/2021 22:26

Hi,
why is Keltner Channels not used in this indicator...? like i see moving averages, bollinger bands but not Keltner Channels.
regards.
///S.Khan