Warning! This section will be deprecated on February 1st 2025. Please move all your Indicators to the cTrader Store catalogue.
Description
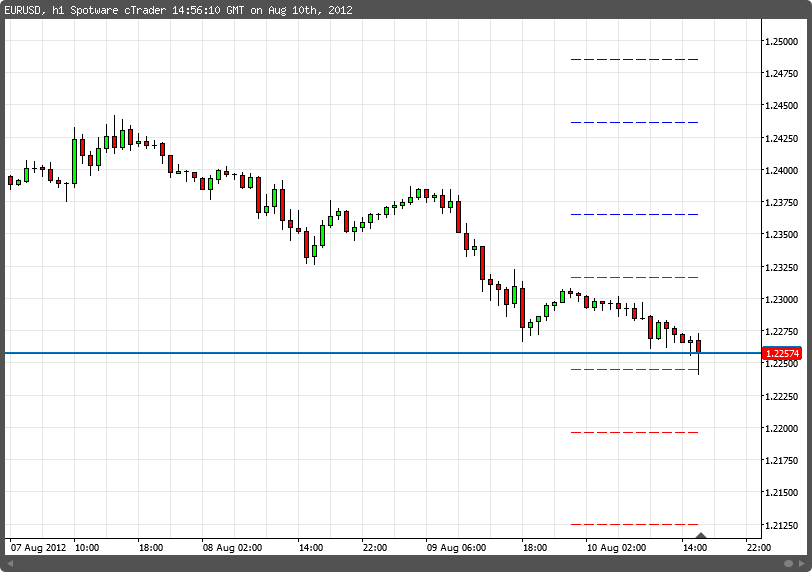
Similar to regular Pivot Points but Pivot Line is calculated with more weight to the closing price. Pivot Points is a method for calculating support and resistance levels. Resistance and support levels indicate where a major price movement is expected. As a trend indicator, it indicates an upward movement, for instance, if the pivot point price is broken in, then the market is bullish, and vice versa. Pivot points are short-term trend indicators, however and therefore useful for only one day. The second method is to use pivot point price levels to enter and exit the markets.

u
MO
moza11
Joined on 30.07.2012
- Distribution: Free
- Language: C#
- Trading platform: cTrader Automate
- File name: WoodiePivotPoints.algo
- Rating: 5
- Installs: 6217
- Modified: 13/10/2021 09:54
Note that publishing copyrighted material is strictly prohibited. If you believe there is copyrighted material in this section, please use the Copyright Infringement Notification form to submit a claim.
Comments
Log in to add a comment.

I found the article to be a breath spacebar clicker of fresh air, offering a new perspective on a topic that is often discussed in a one-dimensional way.