Description
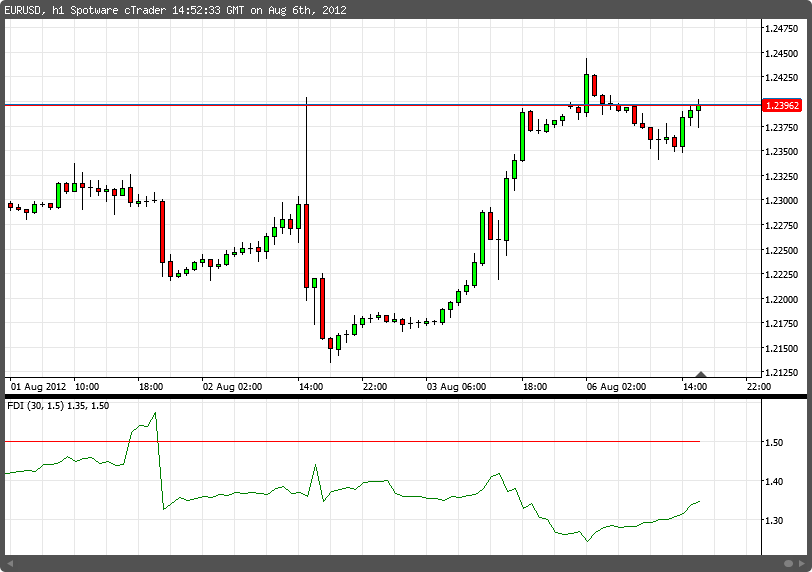
 The FDI ranges between 1.0 and 2.0. FDI approaches 1.0 when prices tend to move in a one-dimensional straight line. Conversely, the more closely prices look like a two-dimensional plane, the closer the FDI moves to 2.0. A trend causes the FDI to move down, and we can expect the trend to end when the FDI reaches the 1.35 level. The FDI does not indicate if the trend will reverse sharply, or if prices will begin to range, but that prices should reverse to perform like a fractal again soon. FDI will move up if the market is not trending. When the FDI reaches 1.55, then a new trend is expected to start. The FDI does not indicate which way prices will break, only that a break should be coming soon.
u
fzlogic
Joined on 06.08.2012
- Distribution: Free
- Language: C#
- Trading platform: cTrader Automate
- File name: FDI.algo
- Rating: 5
- Installs: 4445
- Modified: 13/10/2021 09:54
Comments
Ah sorry, nevermind, I see I can set up my own levels.
Thanks for the indicator, but what's the point of having a midpoint if we're looking at upper (1.55) and lower (1.35) barriers?
great indicator. basically dont open trades when indicator is above the line

Fractals Chaos Oscillator urgent!