Description
Introducing The rsi v2.0 : A Custom RSI Indicator for cTrader
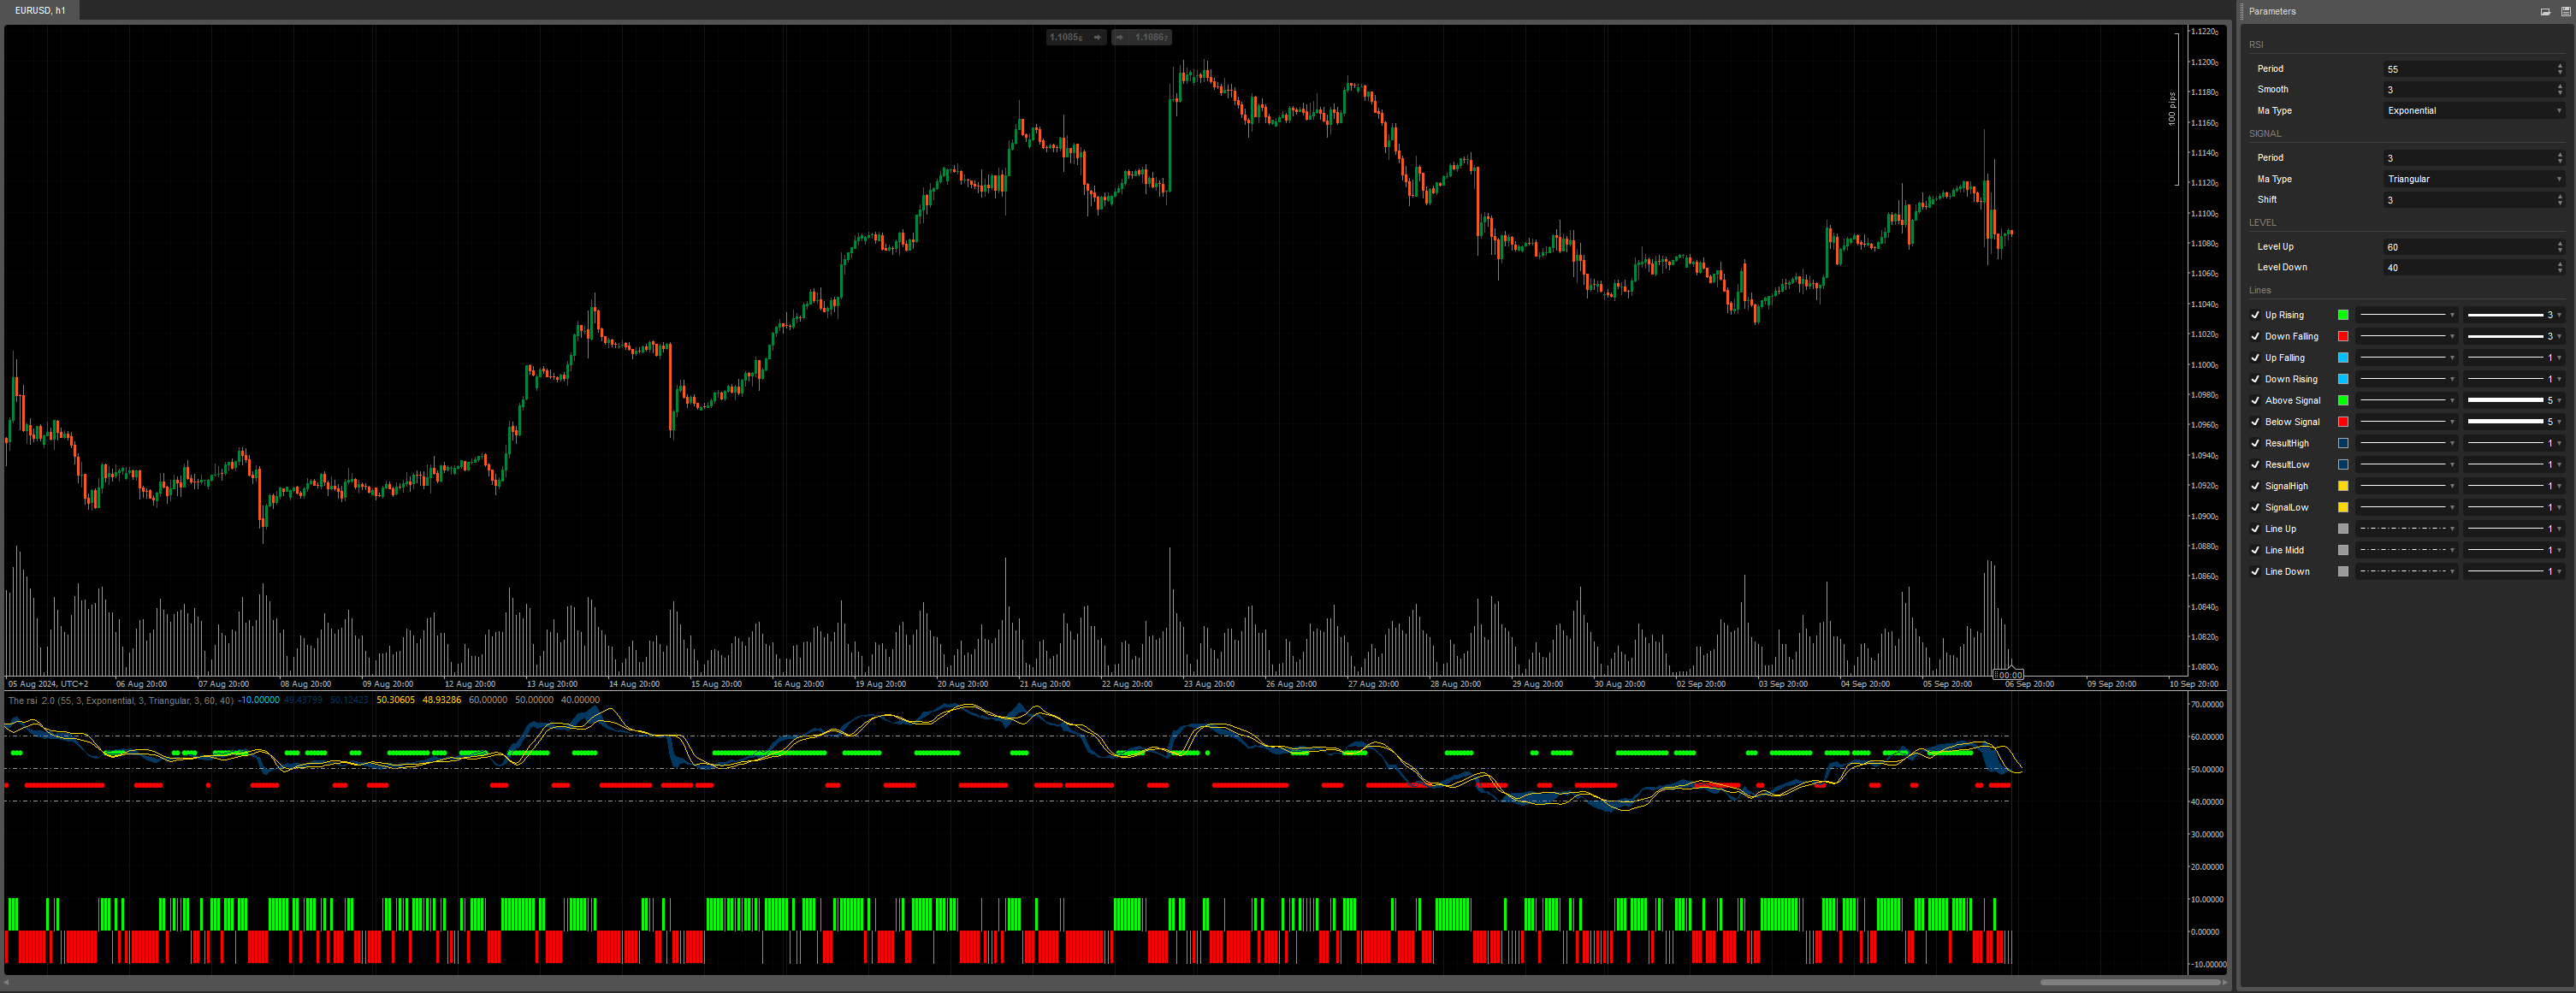
The rsi v2.0 is a custom Relative Strength Index (RSI) indicator designed to provide a clearer interpretation of overbought and oversold conditions, while delivering more accurate trading signals through advanced smoothing mechanisms. This indicator helps traders identify trends and market reversals more effectively by filtering out noise and highlighting key signals.
How It Works
Thersi20 operates similarly to the traditional RSI but with several optimizations to improve accuracy and reduce false signals. It calculates two RSI series based on high and low prices, then applies moving averages to smooth the results and create signal clouds. These clouds allow traders to visualize potential entry and exit points more effectively.
Key Features:
K-Period and D-Period
- The K-Period (default: 55) is the period used to calculate the RSI for high and low prices.
- The D-Period (default: 3) is used to further smooth these values using a moving average.
Signal Shift
- The Shift parameter (default: 3) offsets the signal lines to anticipate future market movements, helping traders make better-informed decisions.
Result and Signal Clouds
- The ResultHigh and ResultLow series display the smoothed RSI results. These indicate whether the market is trending upward or downward.
- The SignalHigh and SignalLow clouds add another layer of filtering to highlight potential reversals.
Level Lines
- The LevelUp (60) and LevelDown (40) parameters define the overbought and oversold zones, which help identify areas where the market might be ready to reverse.
Histogram Visualization
- The histogram helps visualize whether the Result Cloud is rising or falling:
- Up Rising (Lime Green): When both the high and low price Result Clouds are rising.
- Down Falling (Red): When both Result Clouds are falling.
- Up Falling (Deep Sky Blue): When the high price is rising and the low price is falling.
- Down Rising (Deep Sky Blue): When the high price is falling and the low price is rising.
Signal Points
- The Above Signal (above the signal cloud) and Below Signal (below the signal cloud) points indicate strong buy and sell signals, respectively, simplifying decision-making.
How to Use Thersi20
Identify Trends:
- The Result Cloud combined with the histograms helps you determine if the market is trending up or down.
Spot Reversals:
- Use the level lines (60 and 40) to spot overbought and oversold zones. When the RSI approaches these levels, it may indicate an impending reversal.
Timing Entries and Exits:
- If the ResultHigh and ResultLow lines are above their respective signal lines, this may indicate a buying opportunity. If they are below, it could signal a selling opportunity.
Conclusion
Thersi20 is a powerful RSI indicator that offers a more refined approach to detecting overbought and oversold conditions. By incorporating signal clouds, customizable levels, and visual histograms, it provides a deeper understanding of market dynamics. This tool is especially useful for traders seeking to reduce false signals and make more informed trading decisions.
Customize Thersi20 by adjusting the periods, moving average types, and signal levels to fit your trading style on cTrader. Whether you're a novice or experienced trader, this indicator will help you anticipate market moves with greater confidence.
Telegram group : https://t.me/cTraderStrategyTesterProject
GitHub : https://github.com/YesOrNotCtrader/Ctrader-Stragegy-Tester-Project
Enjoy for Free =)
Previous account here : https://ctrader.com/users/profile/70920
Contact telegram : https://t.me/nimi012
using System;
using System.Collections.Generic;
using System.Linq;
using System.Text;
using cAlgo.API;
using cAlgo.API.Collections;
using cAlgo.API.Indicators;
using cAlgo.API.Internals;

namespace cAlgo
{
    [Cloud("ResultHigh", "ResultLow", Opacity = 100)]
    [Indicator(IsOverlay = false, AccessRights = AccessRights.None)]
    public class Thersi20 : Indicator
    {
        [Parameter("Period", DefaultValue = 55, Group = "RSI")]
        public int KPeriod { get; set; }
        [Parameter("Smooth", DefaultValue = 3, Group = "RSI")]
        public int KSlowing { get; set; }
        [Parameter("Ma Type", DefaultValue = MovingAverageType.Exponential, Group = "RSI")]
        public MovingAverageType KSlowingMaType { get; set; }
        [Parameter("Period", DefaultValue = 3, Group = "SIGNAL")]
        public int DPeriod { get; set; }
        [Parameter("Ma Type", DefaultValue = MovingAverageType.Triangular, Group = "SIGNAL")]
        public MovingAverageType DPeriodMaType { get; set; }
        [Parameter("Shift", DefaultValue = 3, Group = "SIGNAL")]
        public int Shift { get; set; }

        [Parameter("Level Up", DefaultValue = 60, Group = "LEVEL")]
        public int LevelUp { get; set; }
        [Parameter("Level Down", DefaultValue = 40, Group = "LEVEL")]
        public int LevelDown { get; set; }

        [Output("Up Rising", IsHistogram = true, LineColor = "Lime", Thickness = 3)]
        public IndicatorDataSeries UpRising { get; set; }
        [Output("Down Falling", IsHistogram = true, LineColor = "Red", Thickness = 3)]
        public IndicatorDataSeries DownFalling { get; set; }
        [Output("Up Falling", IsHistogram = true, LineColor = "DeepSkyBlue", Thickness = 1)]
        public IndicatorDataSeries UpFalling { get; set; }
        [Output("Down Rising", IsHistogram = true, LineColor = "DeepSkyBlue", Thickness = 1)]
        public IndicatorDataSeries DownRising { get; set; }
        [Output("Above Signal", PlotType = PlotType.Points, LineColor = "Lime", Thickness = 5)]
        public IndicatorDataSeries AboveSignal { get; set; }
        [Output("Below Signal", PlotType = PlotType.Points, LineColor = "Red", Thickness = 5)]
        public IndicatorDataSeries BelowSignal { get; set; }

        [Output("ResultHigh", LineColor = "FF013861", Thickness = 1)]
        public IndicatorDataSeries ResultHigh { get; set; }
        [Output("ResultLow", LineColor = "FF013861", Thickness = 1)]
        public IndicatorDataSeries ResultLow { get; set; }
        [Output("SignalHigh", LineColor = "Gold", Thickness = 1)]
        public IndicatorDataSeries SignalHigh { get; set; }
        [Output("SignalLow", LineColor = "Gold", Thickness = 1)]
        public IndicatorDataSeries SignalLow { get; set; }

        [Output("Line Up", PlotType = PlotType.Line, LineStyle = LineStyle.LinesDots, LineColor = "FF999999", Thickness = 1)]
        public IndicatorDataSeries LineUp { get; set; }
        [Output("Line Midd", PlotType = PlotType.Line, LineStyle = LineStyle.LinesDots, LineColor = "FF999999", Thickness = 1)]
        public IndicatorDataSeries LineMidd { get; set; }
        [Output("Line Down", PlotType = PlotType.Line, LineStyle = LineStyle.LinesDots, LineColor = "FF999999", Thickness = 1)]
        public IndicatorDataSeries LineDown { get; set; }

        private RelativeStrengthIndex highData, lowData;
        private MovingAverage kslowHigh, kslowLow, DslowHigh, DslowLow;

        protected override void Initialize()
        {
            highData = Indicators.RelativeStrengthIndex(Bars.HighPrices, KPeriod);
            lowData = Indicators.RelativeStrengthIndex(Bars.LowPrices, KPeriod);

            kslowHigh = Indicators.MovingAverage(highData.Result, KSlowing, KSlowingMaType);
            kslowLow = Indicators.MovingAverage(lowData.Result, KSlowing, KSlowingMaType);
            DslowHigh = Indicators.MovingAverage(kslowHigh.Result, DPeriod, DPeriodMaType);
            DslowLow = Indicators.MovingAverage(kslowLow.Result, DPeriod, DPeriodMaType);
        }

        public override void Calculate(int index)
        {
            //Level Lines
            LineUp[index] = LevelUp;
            LineMidd[index] = 50;
            LineDown[index] = LevelDown;

            //Result Cloud
            ResultHigh[index] = kslowHigh.Result.Last(0);
            ResultLow[index] = kslowLow.Result.Last(0);

            //Signal Cloud
            SignalHigh[index + Shift] = DslowHigh.Result.Last(0);
            SignalLow[index + Shift] = DslowLow.Result.Last(0);

            //Histogram : If RESULT CLOUD is Rising or Falling
            UpRising[index] = ResultHigh.IsRising() && ResultLow.IsRising() ? 10 : double.NaN;
            DownFalling[index] = ResultHigh.IsFalling() && ResultLow.IsFalling() ? -10 : double.NaN;
            UpFalling[index] = ResultHigh.IsRising() && ResultLow.IsFalling() ? 10 : double.NaN;
            DownRising[index] = ResultHigh.IsFalling() && ResultLow.IsRising() ? -10 : double.NaN;

            //Signal Point : If RESULT CLOUD is above or bellow SIGNAL LINES
            AboveSignal[index] = SignalHigh[index] < ResultHigh[index] && SignalLow[index] < ResultLow[index] ? 55 : double.NaN;
            BelowSignal[index] = SignalHigh[index] > ResultHigh[index] && SignalLow[index] > ResultLow[index] ? 45 : double.NaN;

        }
    }
}
YesOrNot2
Joined on 17.05.2024
- Distribution: Free
- Language: C#
- Trading platform: cTrader Automate
- File name: The rsi 2.0.algo
- Rating: 5
- Installs: 1537
- Modified: 08/09/2024 00:51
