Description
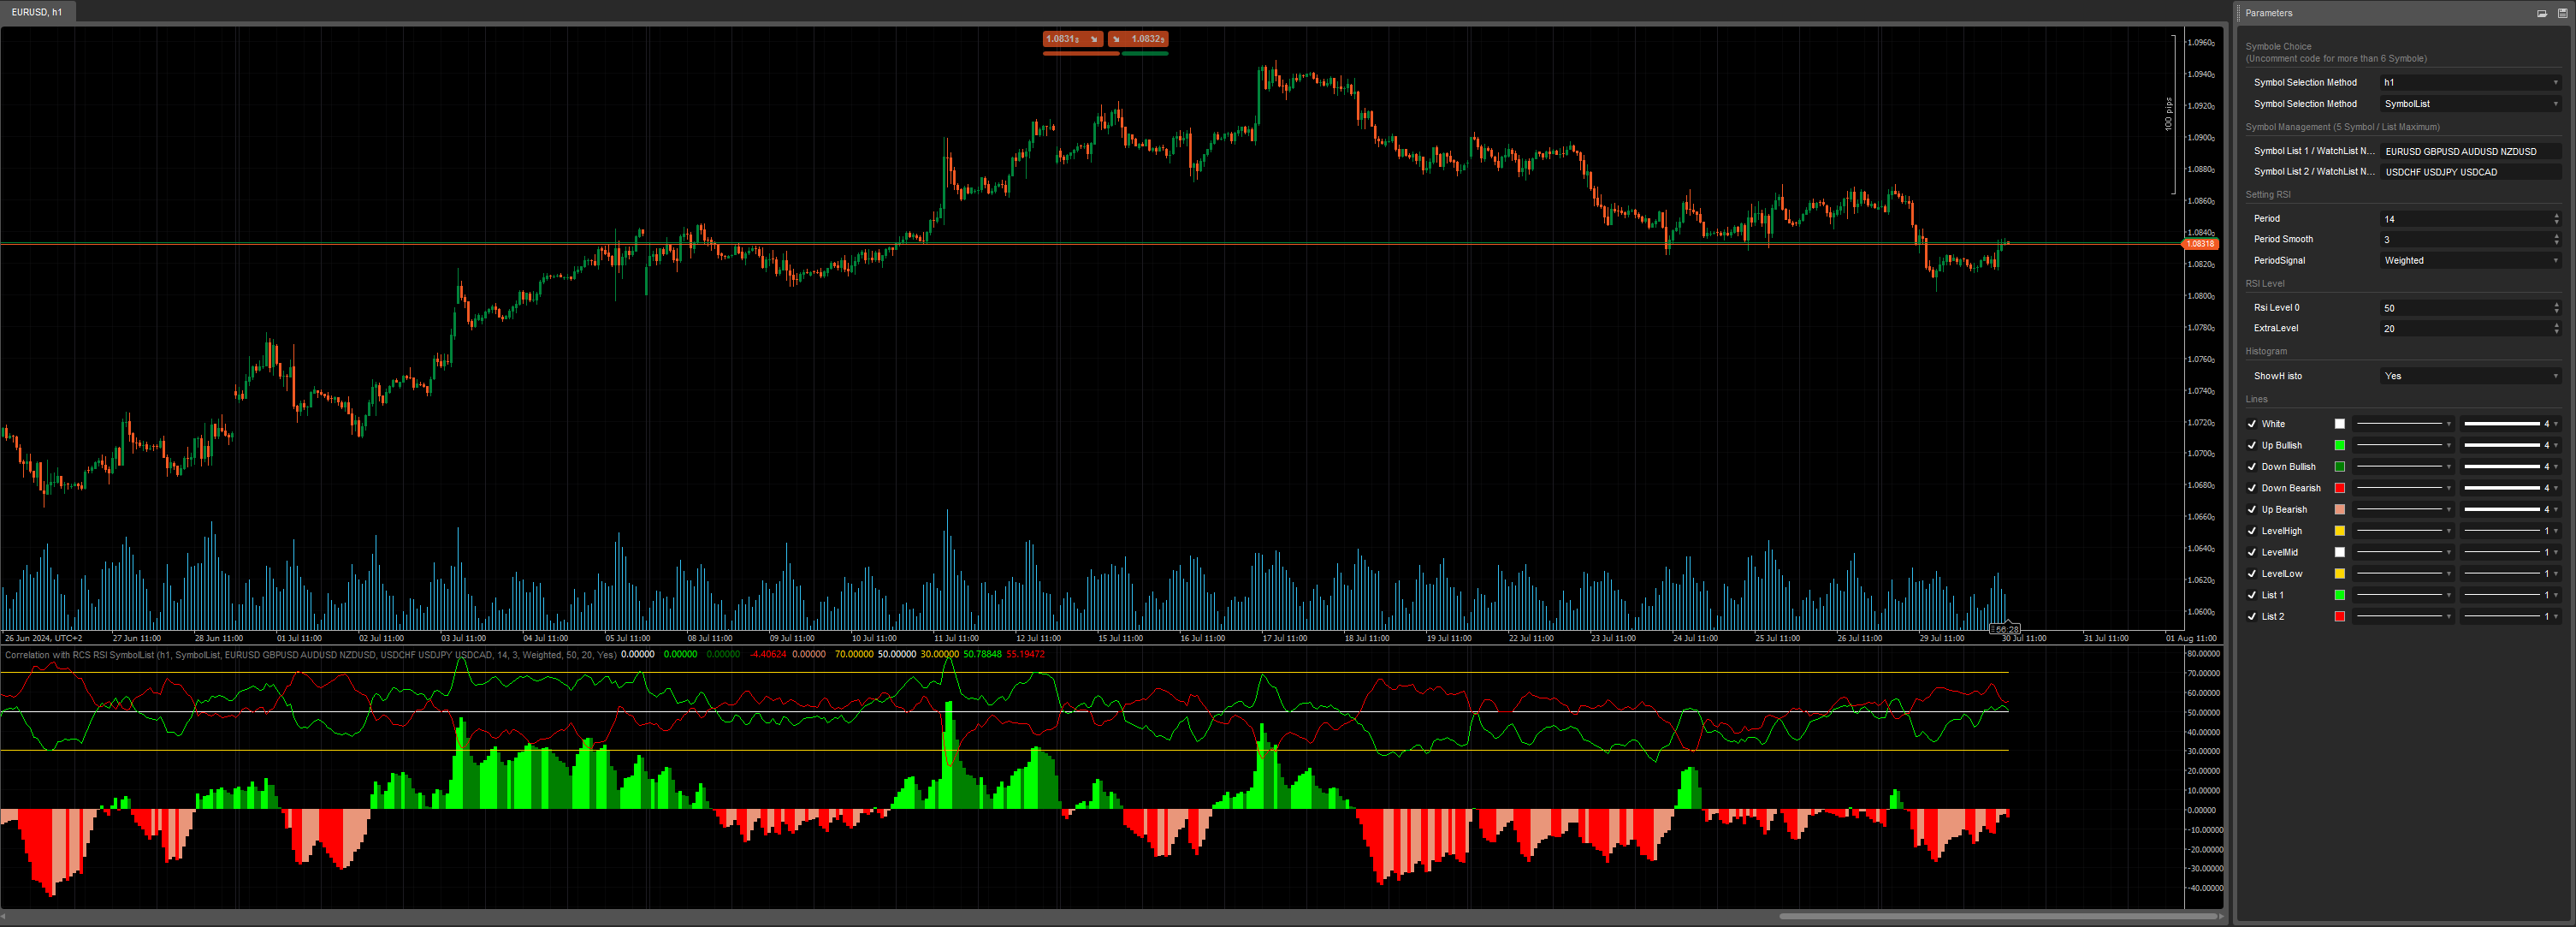
This indicator calculates the RSI values for each symbol in two selected symbol lists: SymbolList 1 and SymbolList 2. For each list, an average RSI is computed, providing a consolidated measure of the relative strength of the price movements of the symbols in each list.
Objective of the Indicator
The primary objective of this indicator is to find an average between several correlated currency pairs within each symbol list. By comparing these averages, the indicator helps identify the true market movements by considering both correlated and inversely correlated symbols. This results in a more precise and reliable overall view of market trends.
Usage for Personal Analysis
If you wish to explore and discover which currency pairs are correlated, use this one : https://ctrader.com/algos/indicators/show/4412/ or this one : https://ctrader.com/algos/indicators/show/3755/ this indicator is an ideal tool. It allows you to create your own analysis method by testing different combinations of symbols. Have fun searching for correlations between symbols and use the results to refine your trading strategies.
In summary, this indicator is designed to help traders understand the complex dynamics of the market by analyzing the correlations between different symbols. It offers an advanced method to reveal the real market movements, thereby facilitating more informed and effective trading decisions.
If you want the REAL RCS RSI it's here : https://ctrader.com/algos/indicators/show/3754/
Enjoy for Free =)
Previous account here : https://ctrader.com/users/profile/70920
Contact telegram : https://t.me/nimi012
using System;
using System.Linq;
using System.Threading;
using cAlgo.API;
using cAlgo.API.Indicators;
using cAlgo.API.Internals;
using cAlgo.Indicators;
using System.Collections.Generic;
using System.IO;
using System.Text;

namespace cAlgo
{
    //[Cloud("Fast Smooth", "Slow Smooth", FirstColor = "Green", SecondColor = "Red", Opacity = 0.1)]
    [Levels(0)]
    [Indicator(IsOverlay = false, TimeZone = TimeZones.UTC, AccessRights = AccessRights.None)]
    public class AngleOfMultiSymbol : Indicator
    {
        [Parameter("Symbol Selection Method", DefaultValue = SymbolSelectionMethodType.SymbolList, Group = "Symbole Choice \n(Uncomment code for more than 6 Symbole)")]
        public SymbolSelectionMethodType SymbolSelectionMethod { get; set; }
        [Parameter("Symbol List", DefaultValue = "EURUSD GBPUSD AUDUSD USDCHF", Group = "Symbole Choice \n(Uncomment code for more than 6 Symbole)")]
        public string TradedSymbols { get; set; }
        [Parameter("Watchlist Name", DefaultValue = "My Watchlist", Group = "Symbole Choice \n(Uncomment code for more than 6 Symbole)")]
        public string WatchlistName { get; set; }

        public enum SymbolSelectionMethodType
        {
            CurrentChart,
            SymbolList,
            WatchList
        }

        [Parameter("History Diff Angle", DefaultValue = 1, Group = "Base Setting")]
        public int HistoryTextLookback { get; set; }
        [Parameter("Tf", DefaultValue = "Hour1", Group = "Base Setting")]
        public TimeFrame Tf { get; set; }
        [Parameter("Price Smooth Period (255)", DefaultValue = 255, Group = "Angle Setting")]
        public int SmoothPeriods { get; set; }
        [Parameter("Price Smooth Type", DefaultValue = MovingAverageType.Weighted, Group = "Angle Setting")]
        public MovingAverageType MaType { get; set; }
        [Parameter("Loockback Periods Angle", DefaultValue = 1, Group = "Angle Setting")]
        public int LookbackPeriodsAngle { get; set; }
        [Parameter("Sensitivity (1.0)", DefaultValue = 1, Group = "Angle Setting")]
        public double Sensitivity { get; set; }

        [Output("Symb n° 1", LineColor = "White", PlotType = PlotType.Line, LineStyle = LineStyle.Solid, Thickness = 1)]
        public IndicatorDataSeries SymbN1 { get; set; }
        [Output("Symb n° 2", LineColor = "Lime", PlotType = PlotType.Line, LineStyle = LineStyle.Solid, Thickness = 1)]
        public IndicatorDataSeries SymbN2 { get; set; }
        [Output("Symb n° 3", LineColor = "Green", PlotType = PlotType.Line, LineStyle = LineStyle.Solid, Thickness = 1)]
        public IndicatorDataSeries SymbN3 { get; set; }
        [Output("Symb n° 4", LineColor = "DeepSkyBlue", PlotType = PlotType.Line, LineStyle = LineStyle.Solid, Thickness = 1)]
        public IndicatorDataSeries SymbN4 { get; set; }
         [Output("Symb n° 5", LineColor = "Red", PlotType = PlotType.Line, LineStyle = LineStyle.Solid, Thickness = 1)]
        public IndicatorDataSeries SymbN5 { get; set; }
        [Output("Symb n° 6", LineColor = "Magenta", PlotType = PlotType.Line, LineStyle = LineStyle.Solid, Thickness = 1)]
        public IndicatorDataSeries SymbN6 { get; set; }

        /*Uncomment For more Symbole on the chart
          [Output("Symb n° 7", LineColor = "Green", PlotType = PlotType.Line, LineStyle = LineStyle.Solid, Thickness = 1)]
          public IndicatorDataSeries SymbN7 { get; set; }
          [Output("Symb n° 8", LineColor = "DeepSkyBlue", PlotType = PlotType.Line, LineStyle = LineStyle.Solid, Thickness = 1)]
          public IndicatorDataSeries SymbN8 { get; set; }
          [Output("Symb n° 9", LineColor = "Red", PlotType = PlotType.Line, LineStyle = LineStyle.Solid, Thickness = 1)]
          public IndicatorDataSeries SymbN9 { get; set; }
          [Output("Symb n° 10", LineColor = "Magenta", PlotType = PlotType.Line, LineStyle = LineStyle.Solid, Thickness = 1)]
          public IndicatorDataSeries SymbN10 { get; set; }
        */

        private MovingAverage[] ma;
        private AverageTrueRange[] atr;

        private Symbol[] TradeList;
        private Bars[] bars;
        private IndicatorDataSeries[] Sources, ResSymbol;
        private int[] indexBars;

        protected override void Initialize()
        {
            if (SymbolSelectionMethod == SymbolSelectionMethodType.WatchList)
            {
                // Get the trade list from the watchlist provided by the user
                foreach (Watchlist w in Watchlists)
                {
                    if (w.Name == WatchlistName)
                    {
                        TradeList = Symbols.GetSymbols(w.SymbolNames.ToArray());
                    }
                }
            }
            else if (SymbolSelectionMethod == SymbolSelectionMethodType.SymbolList)
            {
                // Get the trade list from the sysmbol list provided by the user
                string[] SymbolList = TradedSymbols.ToUpper().Split(' ');

                TradeList = Symbols.GetSymbols(SymbolList);
            }
            else
            {
                TradeList = new Symbol[1];
                TradeList[0] = Symbol;
            }

            atr = new AverageTrueRange[TradeList.Length];
            ma = new MovingAverage[TradeList.Length];
            bars = new Bars[TradeList.Length];
            indexBars = new int[TradeList.Length];
            Sources = new IndicatorDataSeries[TradeList.Length];
            ResSymbol = new IndicatorDataSeries[TradeList.Length];

            Print("{0} traded symbols: ", TradeList.Length);

            int i = 0;
            foreach (var symbol in TradeList)
            {
                Print(symbol.Name);

                bars[i] = MarketData.GetBars(Tf, symbol.Name);
                if (bars[i].OpenTimes[0] > Bars.OpenTimes[0])
                    bars[i].LoadMoreHistory();
                //Load indicators on start up EP5-ATR
                Sources[i] = CreateDataSeries();
                ResSymbol[i] = CreateDataSeries();
                atr[i] = Indicators.AverageTrueRange(bars[i], 500, MovingAverageType.Simple);

                ma[i] = Indicators.MovingAverage(Sources[i], SmoothPeriods, MaType);
                i++;
            }
        }

        public override void Calculate(int index)
        {
            if (index < SmoothPeriods)
                return;

            for (int i = 0; i < TradeList.Length; i++)
            {
                //indexBars[i] = GetIndexByDate(bars[i], Bars.OpenTimes[index]);

                indexBars[i] = bars[i].OpenTimes.GetIndexByTime(Bars.OpenTimes[index]);
                Sources[i][index] = bars[i].ClosePrices[indexBars[i]];
                ResSymbol[i][index] = GetCalculationSymbol(ma[i].Result[index], ma[i].Result[index - LookbackPeriodsAngle], atr[i].Result[indexBars[i]]);
            }

            SymbN1[index] = ResSymbol[0][index];
            SymbN2[index] = ResSymbol[1][index];
            SymbN3[index] = ResSymbol[2][index];
            SymbN4[index] = ResSymbol[3][index];
            SymbN5[index] = ResSymbol[4][index];
            SymbN6[index] = ResSymbol[5][index];

            /* Uncomment For More Symbols on chart
              SymbN7[index] = ResSymbol[2][index];
              SymbN8[index] = ResSymbol[3][index];
              SymbN9[index] = ResSymbol[4][index];
              SymbN10[index] = ResSymbol[5][index];
            */

            IndicatorArea.RemoveAllObjects();

            for (int i = 0; i < TradeList.Length; i++)
            {
                IndicatorArea.DrawText((TradeList[i]).ToString() + index, TradeList[i] + " : " + ResSymbol[i][index].ToString("F2"), index, ResSymbol[i][index], ResSymbol[i][index] > ResSymbol[i][index - HistoryTextLookback] ? Color.Lime : Color.Red);
            }

        }
        public double GetCalculationSymbol(double priceSmooth, double priceSmoothLoockBack, double atr)
        {
            var _momentumpositive = priceSmooth - priceSmoothLoockBack;
            var _momentumnegative = priceSmoothLoockBack - priceSmooth;
            var _momentum = priceSmooth > priceSmoothLoockBack
                         ? _momentumpositive / atr
                         : _momentumnegative / atr;
            var _hypothenuse = Math.Sqrt((_momentum * _momentum) + (LookbackPeriodsAngle * LookbackPeriodsAngle));
            var _cos = (LookbackPeriodsAngle / _hypothenuse);
            var _angle = priceSmooth > priceSmoothLoockBack
                         ? (0 + (Math.Acos(_cos) * 100)) * Sensitivity
                         : (0 - (Math.Acos(_cos) * 100)) * Sensitivity;
            return _angle;
        }
    }
}
YesOrNot2
Joined on 17.05.2024
- Distribution: Free
- Language: C#
- Trading platform: cTrader Automate
- File name: Correlation with RCS RSI SymbolList.algo
- Rating: 5
- Installs: 382
- Modified: 30/07/2024 11:12
