Description
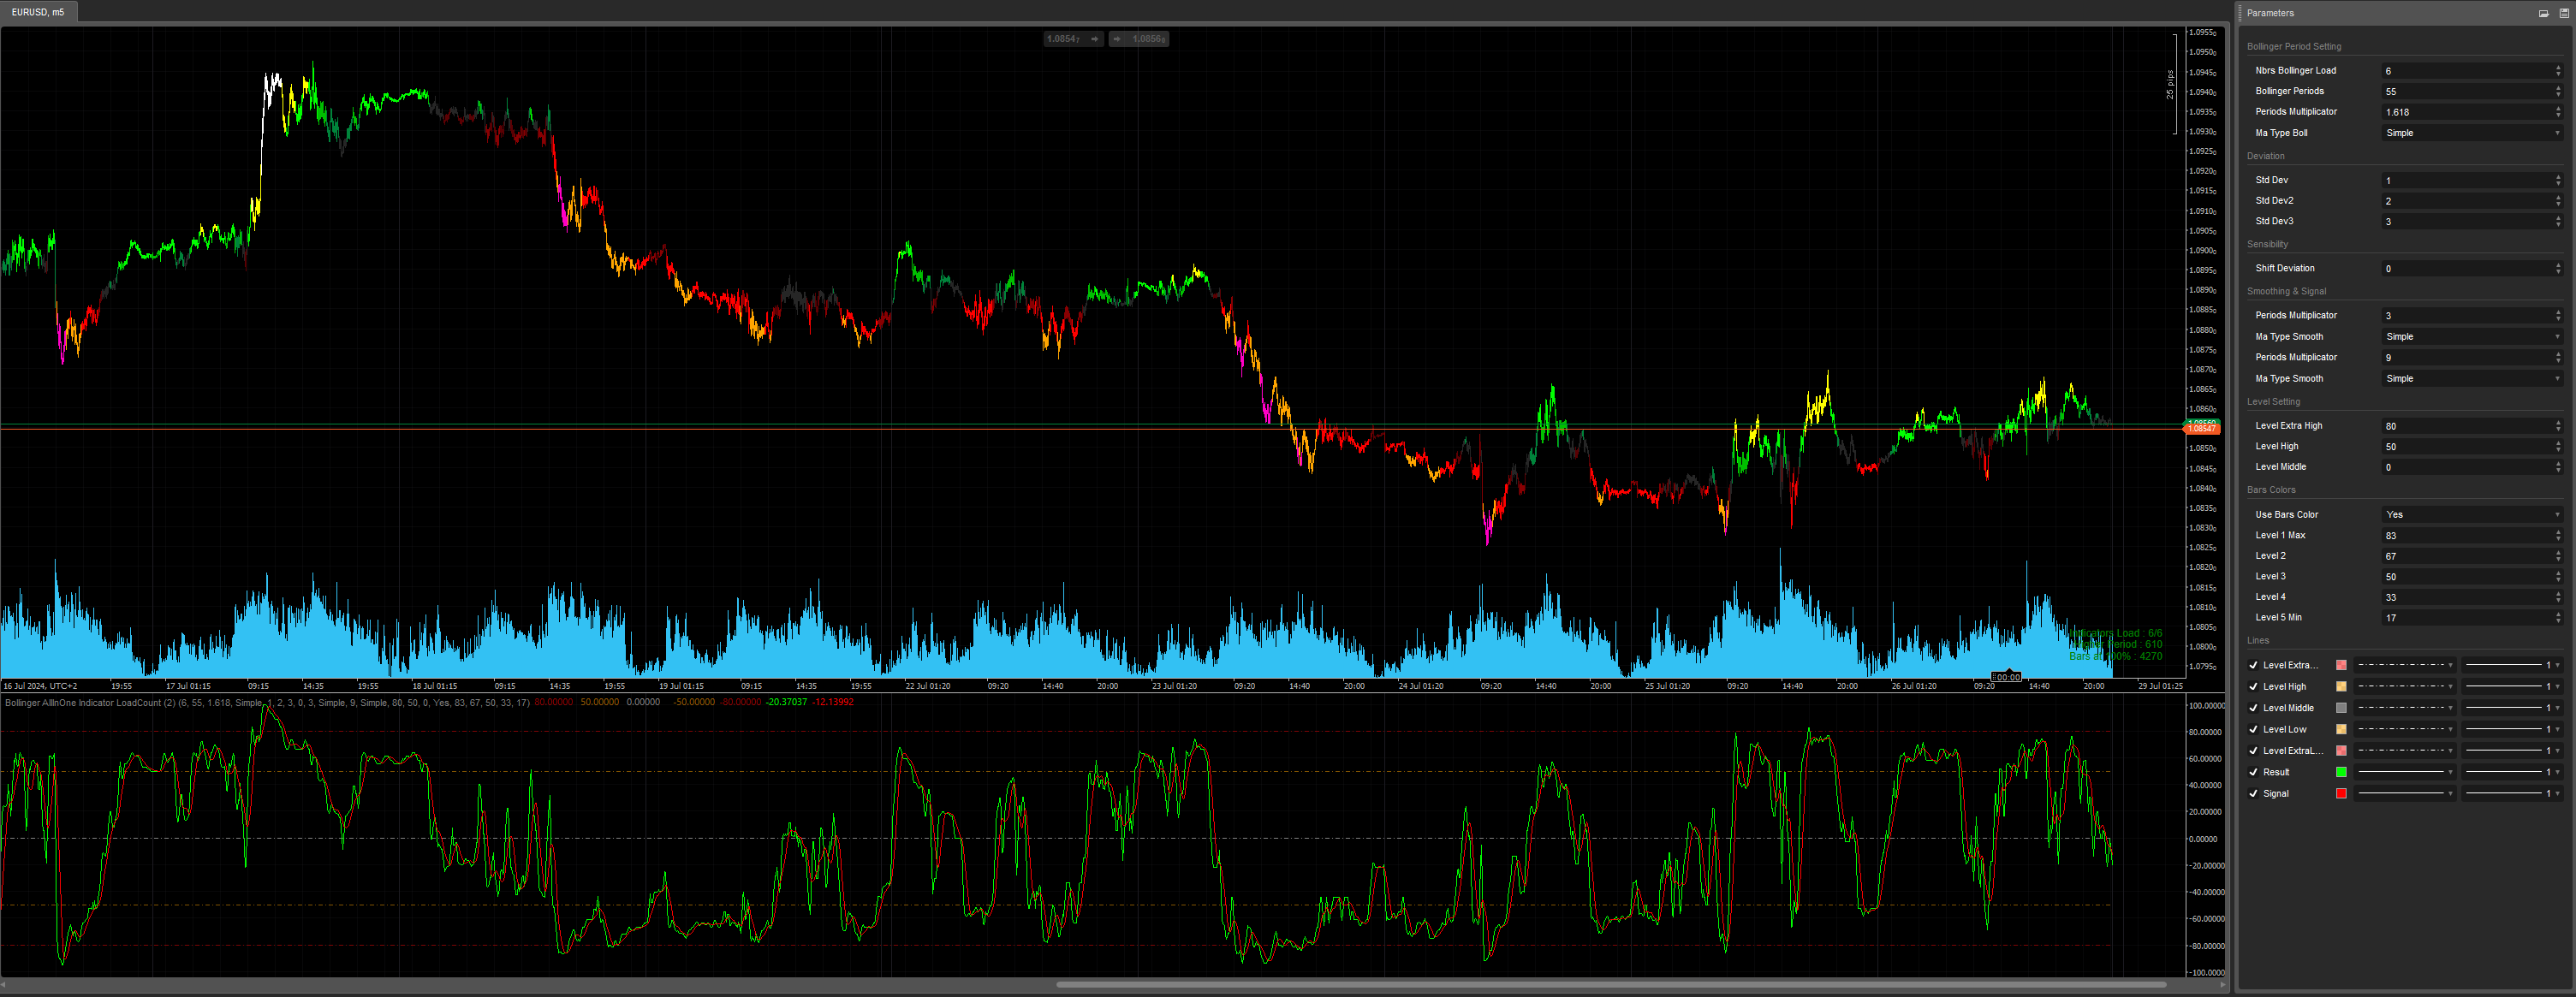
The code above is a custom indicator for a trading platform called cTrader, used to analyze price movements in financial markets. This indicator is called "BollingerAllInOneIndicatorv10" and uses Bollinger Bands to provide trading signals. Here's a detailed explanation for those who are not familiar with coding:
Introduction to Bollinger Bands
Bollinger Bands are a technical analysis tool that consists of three lines plotted in relation to the price of an asset:
- The upper band (Top): typically located two standard deviations above the moving average.
- The lower band (Bottom): typically located two standard deviations below the moving average.
- The middle band (Main): a simple moving average (or another type of moving average).
Bollinger Bands are used to identify overbought or oversold market conditions.
What Does This Indicator Do?
Configuration Parameters:
- NbrsLoad: Number of Bollinger periods to load.
- Periods: Base period for calculating Bollinger Bands.
- PeriodsMultiplicator: Multiplier to adjust the periods of the different Bollinger Bands.
- MaTypeBoll: Type of moving average used for the Bollinger Bands.
- StdDev: Standard deviation for the Bollinger Bands (with three different values).
- Shift: Offset to adjust the Bollinger Bands calculations.
- SmoothingPeriod and SignalPeriod: Periods for smoothing and generating signals.
- SetLevelExtraHigh, SetLevelHigh, SetLevelMiddle: Levels for reference lines.
- UseBarsColors: Indicates if the bars should be colored according to the levels.
Indicator Outputs:
- Lines for specific levels (extra high, high, middle, low, extra low).
- Smoothed results (Result and Signal).
Initialization:
- Configuration of data series and Bollinger Bands according to the defined parameters.
- Calculation of adjusted periods using the multiplier.
- Initialization of moving averages for smoothing and generating signals.
Value Calculation:
- Updating reference levels at each new data point.
- Calculation of Bollinger Bands for each period and each standard deviation.
- Assigning scores based on the price position relative to the Bollinger Bands.
- Calculation of an overall smoothed result and signal.
Bar Coloring:
- Bars are colored based on the defined levels to help visually identify market conditions.
Loading Information Display:
- Displaying the loading progress information of the indicators on the chart.
In Summary
This indicator uses multiple Bollinger Bands with different periods and standard deviations to analyze price movements. It generates smoothed results and signals to aid in trading decisions. The reference levels and bar coloring on the chart provide additional visual cues on market conditions.
Enjoy for Free =)
Previous account here : https://ctrader.com/users/profile/70920
Contact telegram : https://t.me/nimi012
using System;
using cAlgo.API;
using cAlgo.API.Indicators;

namespace cAlgo
{
    [Indicator(IsOverlay = false, TimeZone = TimeZones.UTC, AccessRights = AccessRights.None)]
    public class CCIAllInOneIndicatorLoadCount : Indicator
    {
        [Parameter("Nbrs CCI Load  ", DefaultValue = 6, Group = " Ribbon/BarsColors Setting")]
        public int NbrsCciLoad { get; set; }
        [Parameter("CCI Periods", DefaultValue = 55, Group = " Ribbon/BarsColors Setting")]
        public int PeriodsCCI { get; set; }
        [Parameter("Periods Multi CCI ", DefaultValue = 1.618, Group = " Ribbon/BarsColors Setting")]
        public double PeriodsMultiCCI { get; set; }

        [Parameter("Extra Level", DefaultValue = 100, Group = "Extra Level")]
        public int ExtraLevel { get; set; }

        [Parameter("Level Extra High ", DefaultValue = 80, Group = " Level Setting")]
        public double SetLevelExtraHigh { get; set; }
        [Parameter("Level High", DefaultValue = 50, Group = " Level Setting")]
        public double SetLevelHigh { get; set; }
        [Parameter("Level Middle ", DefaultValue = 0, Group = " Level Setting")]
        public double SetLevelMiddle { get; set; }

        [Parameter("Use Bars Color", DefaultValue = true, Group = "Bars Colors")]
        public bool UseBarsColors { get; set; }

        [Parameter("Level 1 Max ", DefaultValue = 83.33, Group = "Bars Colors")]
        public int LevelBarsColor1 { get; set; }
        [Parameter("Level 2 ", DefaultValue = 66.66, Group = "Bars Colors")]
        public int LevelBarsColor2 { get; set; }
        [Parameter("Level 3 ", DefaultValue = 50, Group = "Bars Colors")]
        public int LevelBarsColor3 { get; set; }
        [Parameter("Level 4 ", DefaultValue = 33.33, Group = "Bars Colors")]
        public int LevelBarsColor4 { get; set; }
        [Parameter("Level 5 ", DefaultValue = 16.66, Group = "Bars Colors")]
        public int LevelBarsColor5 { get; set; }

        [Parameter("Level 6 Max", DefaultValue = -16.66, Group = "Bars Colors")]
        public int LevelBarsColor6 { get; set; }

        [Parameter("Level 7 Middle Min", DefaultValue = -33.33, Group = "Bars Colors")]
        public int LevelBarsColor7 { get; set; }
        [Parameter("Level 8 ", DefaultValue = -50, Group = "Bars Colors")]
        public int LevelBarsColor8 { get; set; }
        [Parameter("Level 9 ", DefaultValue = -66.66, Group = "Bars Colors")]
        public int LevelBarsColor9 { get; set; }
        [Parameter("Level 10 ", DefaultValue = -83.33, Group = "Bars Colors")]
        public int LevelBarsColor10 { get; set; }


        [Output("Result Count", PlotType = PlotType.Line, LineColor = "DeepSkyBlue", Thickness = 1)]
        public IndicatorDataSeries ResultCount { get; set; }

        [Output("Level Extra High", PlotType = PlotType.Line, LineStyle = LineStyle.LinesDots, LineColor = "7BFF0000", Thickness = 1)]
        public IndicatorDataSeries LevelExtraHigh { get; set; }
        [Output("Level High", PlotType = PlotType.Line, LineStyle = LineStyle.LinesDots, LineColor = "81FFA500", Thickness = 1)]
        public IndicatorDataSeries LevelHigh { get; set; }
        [Output("Level Middle", PlotType = PlotType.Line, LineStyle = LineStyle.LinesDots, LineColor = "Gray", Thickness = 1)]
        public IndicatorDataSeries LevelMiddle { get; set; }
        [Output("Level Low", PlotType = PlotType.Line, LineStyle = LineStyle.LinesDots, LineColor = "81FFA500", Thickness = 1)]
        public IndicatorDataSeries LevelLow { get; set; }
        [Output("Level ExtraLow", PlotType = PlotType.Line, LineStyle = LineStyle.LinesDots, LineColor = "7BFF0000", Thickness = 1)]
        public IndicatorDataSeries LevelExtraLow { get; set; }

        private CommodityChannelIndex[] cci;
        private IndicatorDataSeries[] res;
        public IndicatorDataSeries totalLoad;
        private int[] periodsCci;
        private double resIndicator;

        private double barsCount;

        private double indicatorsLoad;
        private double indicatorsNeedLoad;

        protected override void Initialize()
        {
            res = new IndicatorDataSeries[NbrsCciLoad];
            cci = new CommodityChannelIndex[NbrsCciLoad];
            periodsCci = new int[NbrsCciLoad];
            resIndicator = 0.00;
            totalLoad = CreateDataSeries();

            barsCount = Bars.Count;
            indicatorsLoad = 0;
            indicatorsNeedLoad = 0;

            for (int i = 0; i < res.Length; i++)
            {
                periodsCci[i] = (int)(Math.Round(Math.Pow(PeriodsMultiCCI, i) * PeriodsCCI));
                res[i] = CreateDataSeries();
                cci[i] = Indicators.CommodityChannelIndex(periodsCci[i]);
            }

        }
        public override void Calculate(int index)
        {

            LevelExtraHigh[index] = SetLevelExtraHigh;
            LevelHigh[index] = SetLevelHigh;

            LevelMiddle[index] = SetLevelMiddle;

            LevelLow[index] = -SetLevelHigh;
            LevelExtraLow[index] = -SetLevelExtraHigh;

            resIndicator = 0.00;
            barsCount = Bars.Count;

            for (int i = 0; i < res.Length; i++)
            {
                res[i][index] = cci[i].Result[index] >= ExtraLevel ? 2
                               : cci[i].Result[index] <= -ExtraLevel ? -2
                               : cci[i].Result[index] < ExtraLevel && cci[i].Result[index] > 0 ? 1
                               : cci[i].Result[index] > -ExtraLevel && cci[i].Result[index] < 0 ? -1 : 0;

                resIndicator += res[i][index];
                if (barsCount > (periodsCci[i] * 2))
                    indicatorsLoad = i + 1;
            }
            indicatorsNeedLoad = NbrsCciLoad - indicatorsLoad;

            totalLoad[index] = indicatorsLoad;
            ResultCount[index] = ((resIndicator / (totalLoad[index])) * NbrsCciLoad) / (NbrsCciLoad * 2) * 100;


            // Comment for Botting
            if (indicatorsNeedLoad != 0)
                Chart.DrawStaticText("Indicators", indicatorsLoad + "/" + NbrsCciLoad + " Indicators are Load (" + (indicatorsLoad / NbrsCciLoad * 100).ToString("F0") + "%)" + "\nScroll and Load more Bars for " + indicatorsNeedLoad + " Indicators (100%)", VerticalAlignment.Bottom, HorizontalAlignment.Right, Color.Red);
            else
                Chart.RemoveObject("Indicators");

            if (ResultCount[index] > LevelBarsColor1)
                Chart.SetBarColor(index, "White");
            else if (ResultCount[index] <= LevelBarsColor1 && ResultCount[index] > LevelBarsColor2)
                Chart.SetBarColor(index, "Yellow");
            else if (ResultCount[index] <= LevelBarsColor2 && ResultCount[index] > LevelBarsColor3)
                Chart.SetBarColor(index, "FF01FF01");
            else if (ResultCount[index] <= LevelBarsColor3 && ResultCount[index] > LevelBarsColor4)
                Chart.SetBarColor(index, "FF00BF00");
            else if (ResultCount[index] <= LevelBarsColor4 && ResultCount[index] > LevelBarsColor5)
                Chart.SetBarColor(index, "FF00843B");
            //Middle
            else if (ResultCount[index] <= LevelBarsColor5 && ResultCount[index] > LevelBarsColor6)
                Chart.SetBarColor(index, "FF262626");
            //Down
            else if (ResultCount[index] <= LevelBarsColor6 && ResultCount[index] > LevelBarsColor7)
                Chart.SetBarColor(index, "FF5B0003");
            else if (ResultCount[index] <= LevelBarsColor7 && ResultCount[index] > LevelBarsColor8)
                Chart.SetBarColor(index, "FF890002");
            else if (ResultCount[index] <= LevelBarsColor8 && ResultCount[index] > LevelBarsColor9)
                Chart.SetBarColor(index, "FFFE0000");
            else if (ResultCount[index] <= LevelBarsColor9 && ResultCount[index] > LevelBarsColor10)
                Chart.SetBarColor(index, "Orange");
            else if (ResultCount[index] <= LevelBarsColor10)
                Chart.SetBarColor(index, "FFFF00C5");
            //End Comment
        }
    }
}
YesOrNot2
Joined on 17.05.2024
- Distribution: Free
- Language: C#
- Trading platform: cTrader Automate
- File name: Bollinger AllInOne Indicator v1.0.algo
- Rating: 0
- Installs: 400
- Modified: 27/07/2024 09:01
