Category Volatility  Published on 17/02/2014

Bollinger Bands Width

Description

Bollinger Bands Width is a technical analysis indicator derived from the standard Bollinger Bands indicator. Bollinger Bands are a volatility indicator which creates a band of three lines which are plotted in relation to a security's price. The Middle Line is typically a 20 Day Simple Moving Average. The Upper and Lower Bands are typically 2 standard deviations above and below the SMA (Middle Line). Bollinger Bands Width serve as a way to quantitatively measure the width between the Upper and Lower Bands. BBW can be used to identify trading signals in some instances.
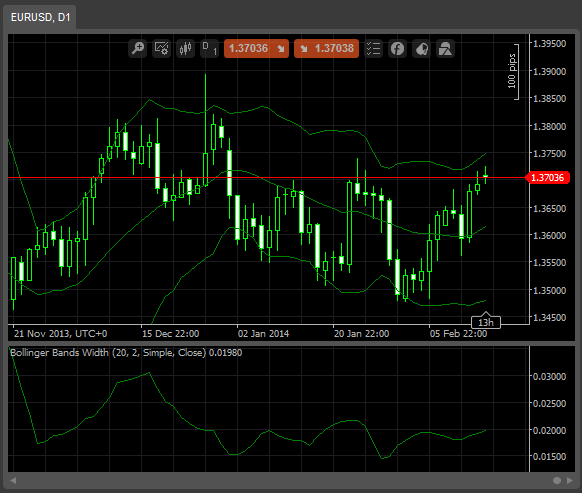
John Bollinger, introduced Bollinger Bands Width in 2010 almost 3 decades after the introduction of his Bollinger Bands.


u

modarkat's avatar
modarkat

Joined on 25.12.2013

  • Distribution: Free
  • Language: C#
  • Trading platform: cTrader Automate
  • File name: Bollinger Bands Width.algo
  • Rating: 0
  • Installs: 6212
  • Modified: 13/10/2021 09:54
Comments
Log in to add a comment.
SO
sohoj · 9 years ago

Here is modified code.Coding seems easy in Calgo

Language: C#
Trading Platform: cAlgocTrader

using cAlgo.API;
using cAlgo.API.Indicators;

namespace cAlgo.Indicators
{
    [Indicator(IsOverlay = falseScalePrecision = 5, AccessRights = AccessRights.None)]
    public class BollingerBandsWidth : Indicator
    {
        [Parameter("Period", DefaultValue = 20)]
        public int Period get; set; }

        [Parameter("SD Weight Coef", DefaultValue = 2)]
        public int K get; set; }

        [Parameter("MA Type", DefaultValue = MovingAverageType.Simple)]
        public MovingAverageType MaType get; set; }

        [Parameter()]
        public DataSeries Source get; set; }

        private BollingerBands _bollingerBands;

        [Output("diff", PlotType = PlotType.Histogram)]
        public IndicatorDataSeries Diff get; set; }

        protected override void Initialize()
        {
            _bollingerBands = Indicators.BollingerBands(Source, Period, K, MaType);
        }

        public override void Calculate(int index)
        {
            Diff[index] = (_bollingerBands.Top[index] - _bollingerBands.Bottom[index]) / _bollingerBands.Main[index];
        }
    }
}

SO
sohoj · 9 years ago

Is it possible to plot the this indicator as histogram instead of lines.Please do this. 


Thanks in advance.

trader_ak's avatar
trader_ak · 10 years ago

Well done, thank you. :)