Warning! This section will be deprecated on February 1st 2025. Please move all your Indicators to the cTrader Store catalogue.
Description
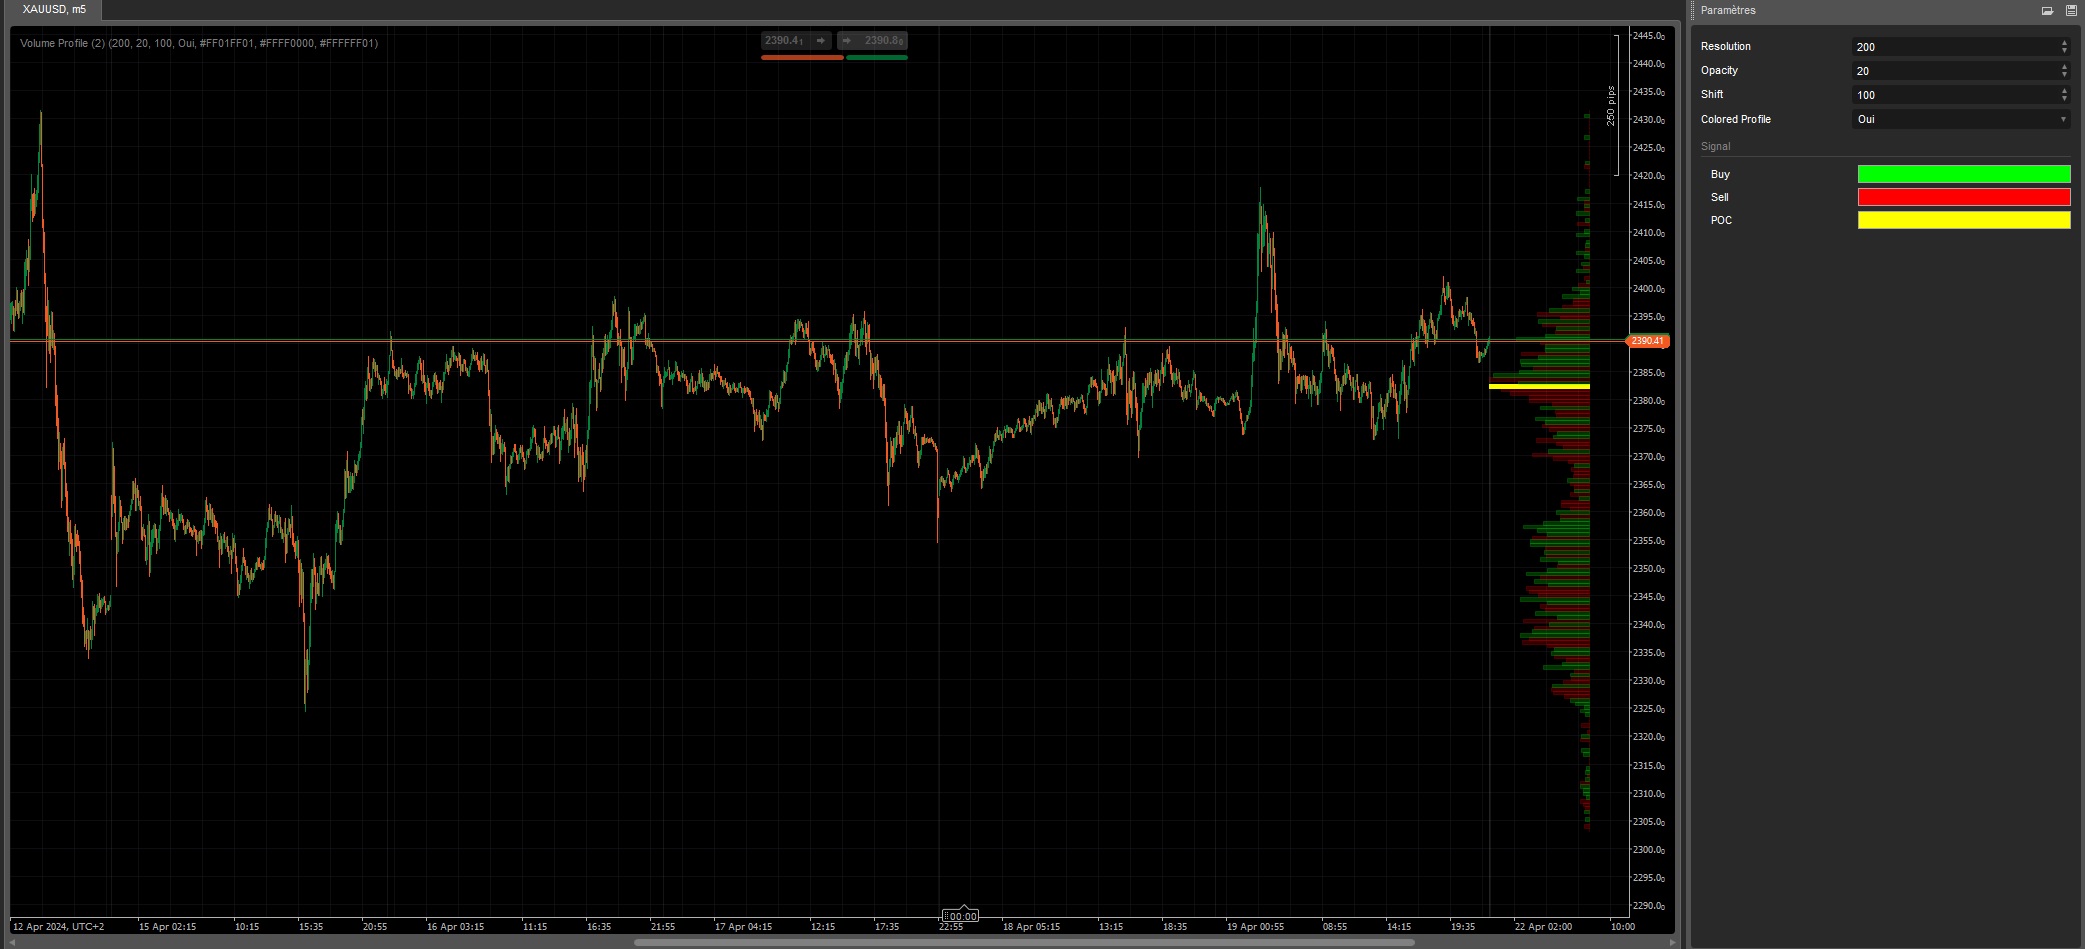
Volume Profile.
This indicator is supposed to be a volume profile, but I'm not entirely sure about the logic to define the colors. Any ideas?
using System;
using cAlgo.API;
using cAlgo.API.Internals;
using cAlgo.API.Indicators;

namespace cAlgo
{
    [Indicator(IsOverlay = true, TimeZone = TimeZones.UTC, AccessRights = AccessRights.None)]
    public class VolumeProfile : Indicator
    {
        [Parameter("Resolution", DefaultValue = 250)]
        public int Resolution { get; set; }

        [Parameter("Opacity", DefaultValue = 20)]
        public int Opacity { get; set; }
        [Parameter("Shift", DefaultValue = 100)]
        public int Shift { get; set; }

        [Parameter("Colored Profile", DefaultValue = true)]
        public bool Colored { get; set; }
        [Parameter("Buy", Group = "Signal", DefaultValue = "Lime")]
        public Color BuyColor { get; set; }
        [Parameter("Sell", Group = "Signal", DefaultValue = "Red")]
        public Color SellColor { get; set; }
        [Parameter("POC", Group = "Signal", DefaultValue = "Yellow")]
        public Color PocColor { get; set; }

        protected override void Initialize()
        {
            Opacity = (int)(255 * 0.01 * Opacity);
        }

        public override void Calculate(int index)
        {
            if (!IsLastBar) return;

            CalculateVolumeProfile(0, Bars.Count - 1);
        }

        private void CalculateVolumeProfile(int start, int end)
        {
            double max = double.MinValue, min = double.MaxValue;
            double maxValue = 0;
            double[,] values = new double[Resolution, 2];
            int pocIndex = 0; // Index for the Point of Control
            double pocMaxVolume = 0; // Volume at the Point of Control

            for (int i = start; i <= end; i++)
            {
                max = Math.Max(max, Bars.HighPrices[i]);
                min = Math.Min(min, Bars.LowPrices[i]);
            }

            double rangePips = (max - min) / Resolution;

            for (int i = 0; i < Resolution; i++)
            {
                double lowerBound = min + i * rangePips;
                double upperBound = lowerBound + rangePips;

                for (int k = start; k <= end; k++)
                {
                    if (Bars.ClosePrices[k] >= lowerBound && Bars.ClosePrices[k] < upperBound)
                    {
                        if (Bars.OpenPrices[k] < Bars.ClosePrices[k])
                            values[i, 0] += Bars.TickVolumes[k]; // Bullish volume
                        else
                            values[i, 1] += Bars.TickVolumes[k]; // Bearish volume
                    }
                }

                double totalVolume = values[i, 0] + values[i, 1];
                if (totalVolume > pocMaxVolume)
                {
                    pocMaxVolume = totalVolume;
                    pocIndex = i;
                }
                maxValue = Math.Max(maxValue, totalVolume);
            }

            Chart.RemoveAllObjects();

            for (int i = 0; i < Resolution; i++)
            {
                int x1 = (int)(end + Shift);
                int x2 = (int)(x1 - (values[i, 0] / maxValue) * 100);
                int x3 = (int)(x1 - ((values[i, 0] + values[i, 1]) / maxValue) * 100);

                Color rectColor = (i == pocIndex) ? PocColor : (Colored ? (values[i, 0] > values[i, 1] ? BuyColor : SellColor) : Color.Cyan);

                Chart.DrawRectangle("VP" + i, x3, min + i * rangePips, x1, min + (i + 1) * rangePips, Color.FromArgb(i == pocIndex ? 255 : Opacity, rectColor)).IsFilled = true;
            }
        }
    }
}
YE
YesOrNot
Joined on 10.10.2022 Blocked
- Distribution: Free
- Language: C#
- Trading platform: cTrader Automate
- File name: Volume Profile v1.01.algo
- Rating: 5
- Installs: 455
- Modified: 21/04/2024 00:42
Note that publishing copyrighted material is strictly prohibited. If you believe there is copyrighted material in this section, please use the Copyright Infringement Notification form to submit a claim.
Comments
Log in to add a comment.
No comments found.
