Warning! This section will be deprecated on February 1st 2025. Please move all your Indicators to the cTrader Store catalogue.
Description
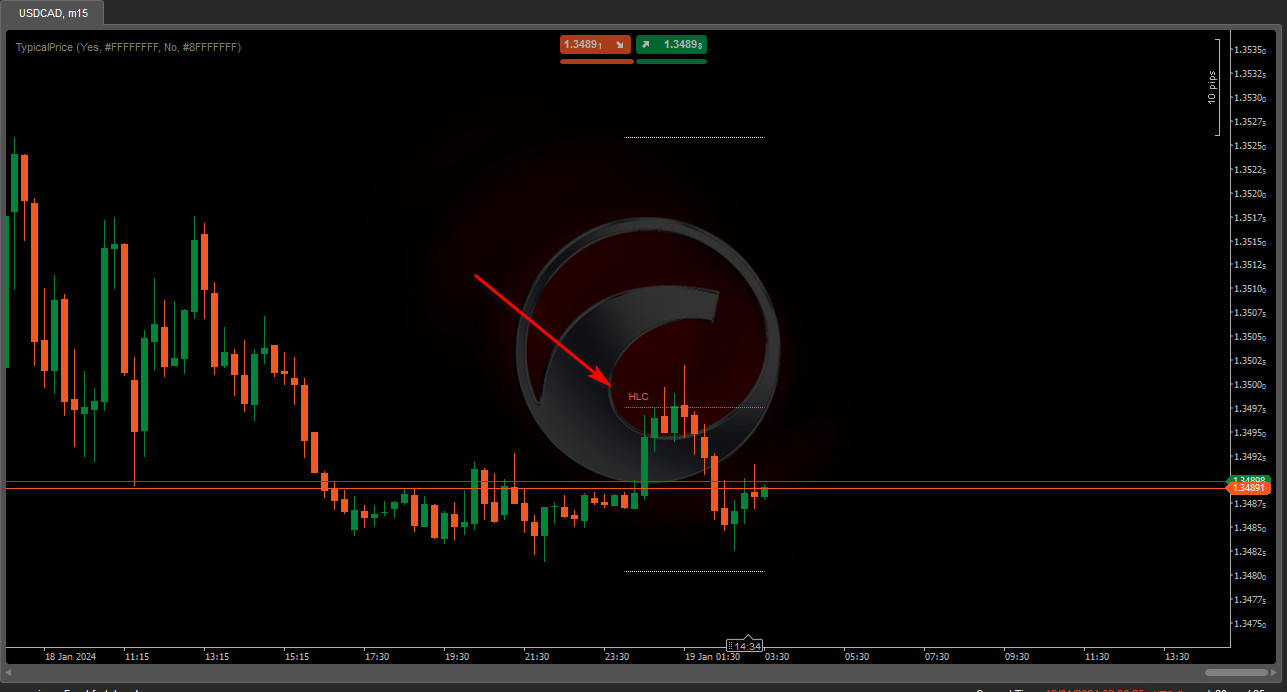
The Typical Price Indicator (TPI) shows you daily and weekly Typical Price areas by drawing 3 horizontal lines. Price reactions to these 3 areas are very important and all professional traders pay close attention to them.
This indicator measures the average High, Low and Closing prices of the previous day and last week using a simple, single-line chart.
The formula of Typical Price = ( High Price + Low Price + Close Price ) / 3 or popularly known as HLC/3.
- TPI is commonly used by traders to determine the support and resistance levels.
- This indicator only draws the previous day's TPI linearly for you, and to avoid cluttering the chart, the values of previous days are avoided.
With a simple search on the Internet, you can find out the importance of this line and find various trading strategies with TPI

using System;
using System.Collections.Generic;
using System.Linq;
using System.Text;
using cAlgo.API;
using cAlgo.API.Collections;
using cAlgo.API.Indicators;
using cAlgo.API.Internals;

namespace cAlgo
{
    [Indicator(AccessRights = AccessRights.FullAccess, IsOverlay = true, TimeZone = TimeZones.EasternStandardTime)]
    public class TypicalPrice : Indicator
    {
        [Parameter("Show Daily Typical Price ", Group = "Setting", DefaultValue = true)]
        public bool Daily_TPprice { get; set; }
        [Parameter("Daily Tpl Color", Group = "Setting", DefaultValue = "#92FFFF01")]
        public Color DailyTpriceColor { get; set; }
        [Parameter("Show Weekly Typical Price ", Group = "Setting", DefaultValue = false)]
        public bool Weekly_TPprice { get; set; }
        [Parameter("Weekly Tpl Color", Group = "Setting", DefaultValue = "#8FFFFFFF")]
        public Color WeeklyTpriceColor { get; set; }


        public Bars bars_d1;
        public Bars bars_w1;
        public double high_price = 0;
        public double low_price = 0;
        public double close_price = 0;
        public double typical_price = 0;
        public Color tp_color;

        public ChartTrendLine Tline;
        public DateTime StartTime;
        public DateTime EndTime;
        public DateTime newyorkTime;
        public Bars bars_m1;

        protected override void Initialize()
        {
            if (Daily_TPprice && Bars.TimeFrame < TimeFrame.Hour12)
            {
                StartTime = Time.Date + TimeSpan.Parse("00:00:00");
                EndTime = Time.Date + TimeSpan.Parse("23:59:00");
                bars_d1 = MarketData.GetBars(TimeFrame.Daily, Symbol.Name);
                if (bars_d1.Last(1).Close > bars_d1.Last(1).Open)
                    tp_color = Color.Green;
                else
                    tp_color = Color.IndianRed;
                typical_price = (bars_d1.Last(1).High + bars_d1.Last(1).Low + bars_d1.Last(1).Close) / 3;
                Tline = Chart.DrawTrendLine("high_price", StartTime, bars_d1.Last(1).High, Bars.LastBar.OpenTime, bars_d1.Last(1).High, DailyTpriceColor, 1, LineStyle.Dots);
                Tline = Chart.DrawTrendLine("low_price", StartTime, bars_d1.Last(1).Low, Bars.LastBar.OpenTime, bars_d1.Last(1).Low, DailyTpriceColor, 1, LineStyle.Dots);
                Tline = Chart.DrawTrendLine("typical_price", StartTime, typical_price, Bars.LastBar.OpenTime, typical_price, tp_color, 1, LineStyle.Dots);
                var text = Chart.DrawText("daily typical_price text ", "HLC", StartTime, typical_price, tp_color);
                text.HorizontalAlignment = API.HorizontalAlignment.Right;
                text.VerticalAlignment = VerticalAlignment.Top;
                text.FontSize = 10;
            }
            if (Weekly_TPprice && Bars.TimeFrame < TimeFrame.Weekly)
            {
                bars_w1 = MarketData.GetBars(TimeFrame.Weekly, Symbol.Name);
                if (bars_w1.Last(1).Close > bars_w1.Last(1).Open)
                    tp_color = Color.Green;
                else
                    tp_color = Color.IndianRed;
                typical_price = (bars_w1.Last(1).High + bars_w1.Last(1).Low + bars_w1.Last(1).Close) / 3;
                Tline = Chart.DrawTrendLine("w high_price", bars_w1.Last(0).OpenTime, bars_w1.Last(1).High, Bars.Last(0).OpenTime, bars_w1.Last(1).High, WeeklyTpriceColor);
                Tline = Chart.DrawTrendLine("w low_price", bars_w1.Last(0).OpenTime, bars_w1.Last(1).Low, Bars.Last(0).OpenTime, bars_w1.Last(1).Low, WeeklyTpriceColor);
                Tline = Chart.DrawTrendLine("w typical_price", bars_w1.Last(0).OpenTime, typical_price, Bars.Last(0).OpenTime, typical_price, tp_color);
                var text = Chart.DrawText("w typical_price text ", "W-HLC", bars_w1.Last(0).OpenTime, typical_price, tp_color);
                text.HorizontalAlignment = API.HorizontalAlignment.Right;
                text.VerticalAlignment = VerticalAlignment.Top;
                text.FontSize = 10;
            }

        }

        public override void Calculate(int index)
        {
            // Calculate value at specified index
            // Result[index] =
        }
    }
}
AlgoCreators
Joined on 16.01.2022
- Distribution: Free
- Language: C#
- Trading platform: cTrader Automate
- File name: TypicalPrice.algo
- Rating: 5
- Installs: 789
- Modified: 19/01/2024 08:35
Note that publishing copyrighted material is strictly prohibited. If you believe there is copyrighted material in this section, please use the Copyright Infringement Notification form to submit a claim.
Comments
Log in to add a comment.
No comments found.
