Description
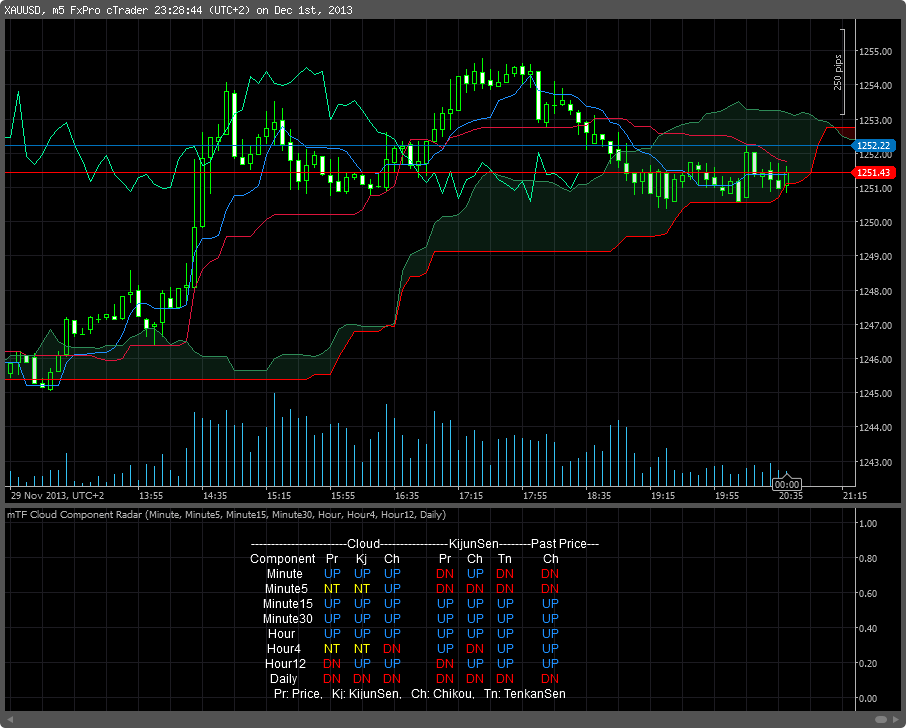
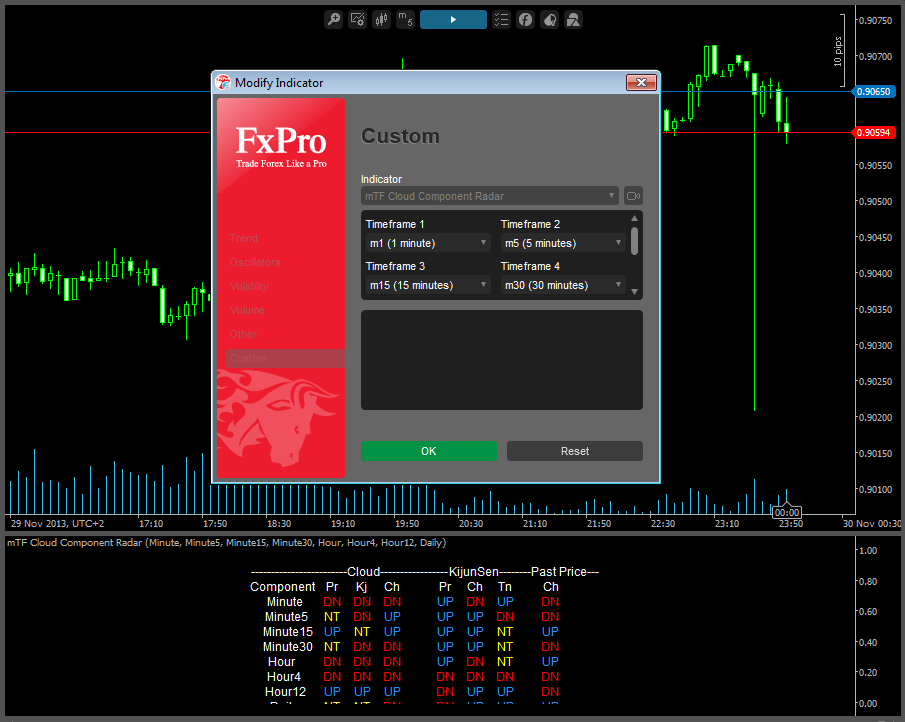
This is a more enhanced version of my previous "mTF Ichimoku Radar" as it shows the position of the Ichimoku components with respect to the Kumo, the KijunSen and the Past Price over different timeframes (user can select up to 8).

Note: Changing IsOverlay from false to true the indicator displays directly onto the chart, thus saving some screen real estate.
6th line in the code: [Indicator(IsOverlay = false, TimeZone = TimeZones.UTC)]
Some useful info about the Ichimoku Kinko Hyo System:
http://en.wikipedia.org/wiki/Ichimoku_Kink%C5%8D_Hy%C5%8D
http://www.kumotrader.com/ichimoku_wiki/index.php?title=Ichimoku_trading_strategies
u
gedet
Joined on 20.08.2013
- Distribution: Free
- Language: C#
- Trading platform: cTrader Automate
- File name: mTF Cloud Component Radar.algo
- Rating: 0
- Installs: 3709
- Modified: 13/10/2021 09:54
Comments
ah its the cTrader built-in version that shows the components on the chart :D thanks man
@wifirex this indicator does not actually display the Ichimoku components its rather based on the built in indicator in order to show the position of the Ichimoku components for various timeframes. Every ichimoku indicator I have encountered on the cAlgo platform, including the built in ichimoku indicator, lets you chose the appearance of the components.
Is there a way to just have the Kumo, Kijun & Tenkensen lines on the chart? It would be cool if we could change the colours of the lines too :D
I have not figured this one out yet, that's why I chose to display the indicator below the chart. Ideally I would like to allow the user to chose at which corner to display the indicator...

Hi Awesome indicator.
How did you write the color shading between the two lines in C Algo.
I wanted to do that with Bollinger Bands ie. Color shade between the upper and lower bands.
Cheers