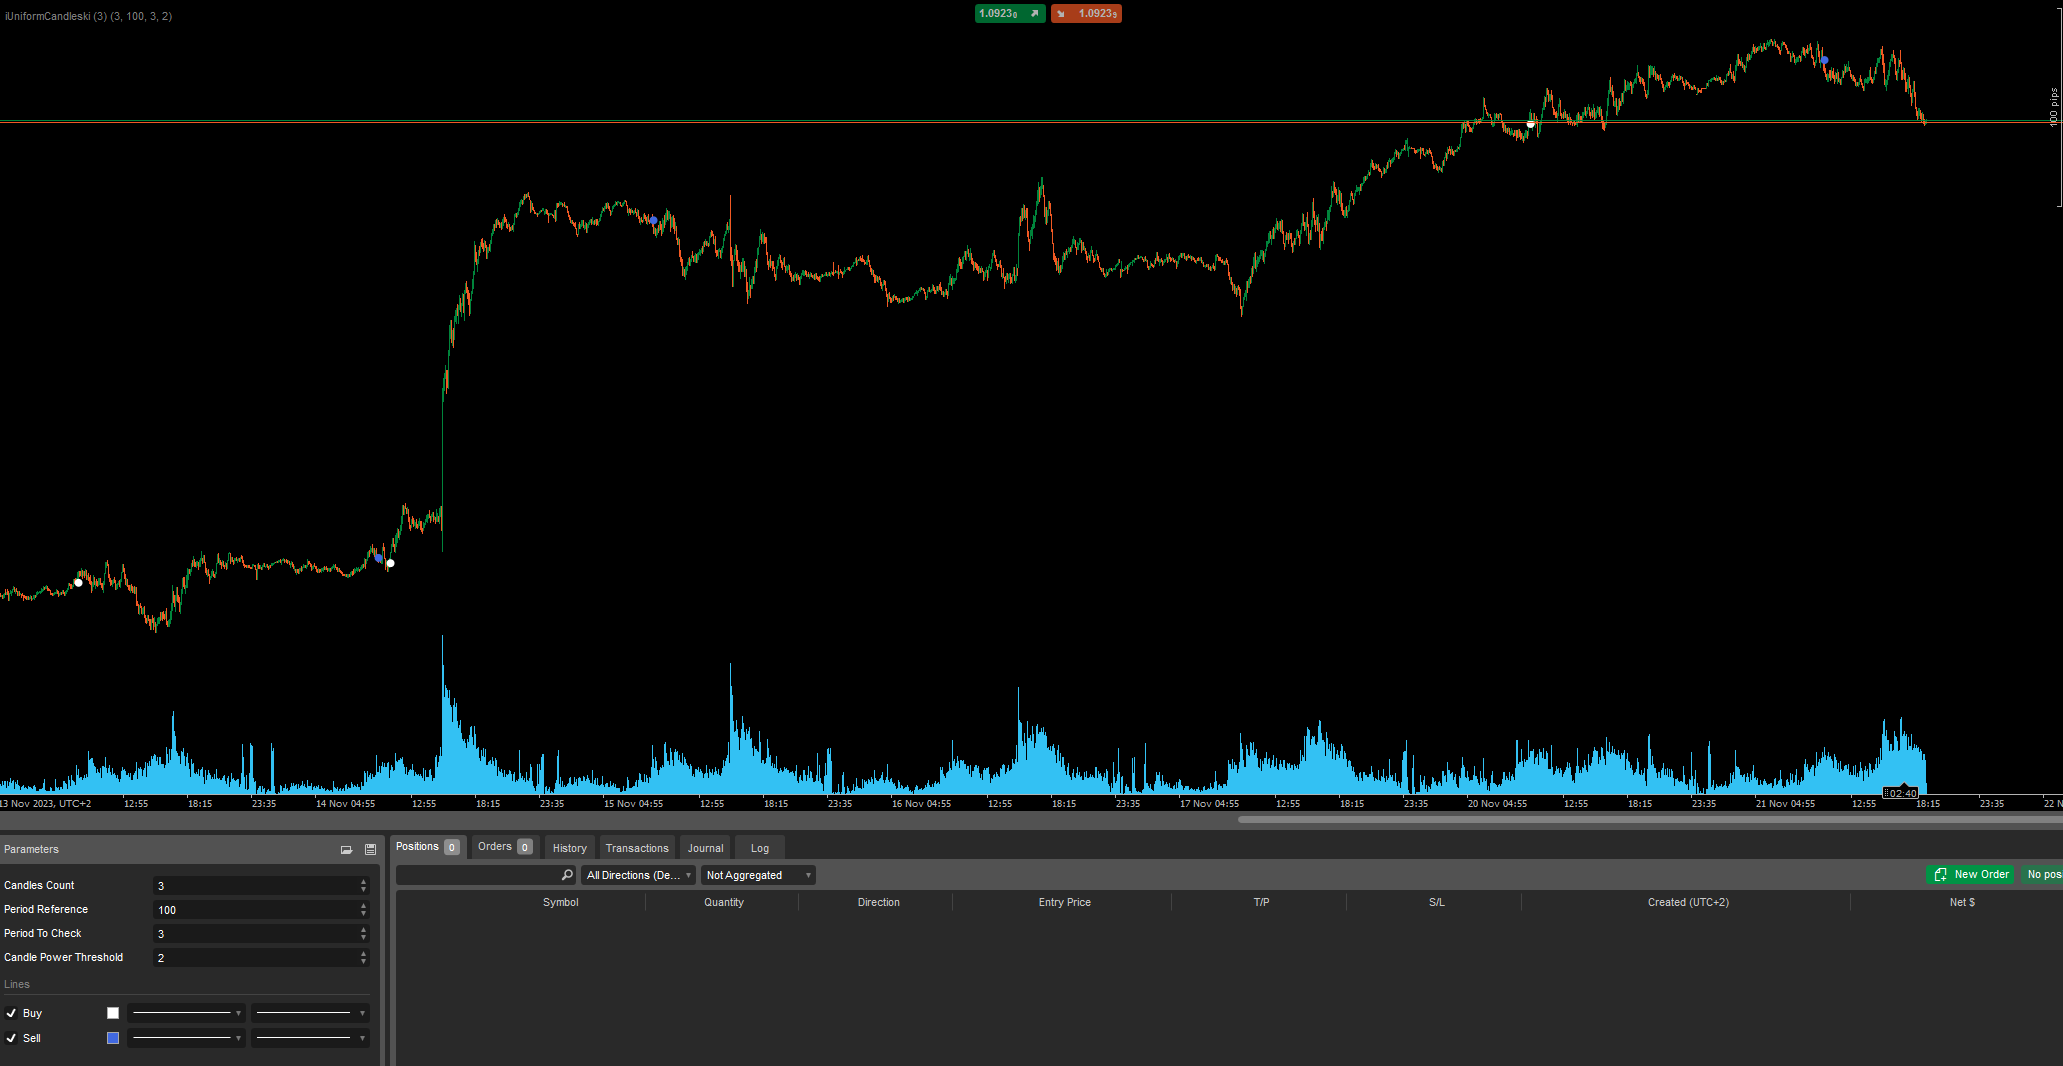
Description
"To download the extraordinary Dr. khashix, please visit the drkhashix.com."
"Vittaverse is the best broker for bot and traid; they support a variety of currencies, have low spreads, and most importantly, provide you with funding."
this is link: click here for sign up Vittaverse
The "Similar candle color combine by candle power" indicator combines the analysis of candle color similarity and candlestick power to generate Buy or Sell signals. Here's an explanation of how to use the indicator:

Parameters:
Candles Count:
- Determines the number of consecutive candles with the same color required to trigger a signal (Buy or Sell).
Period Reference:
- Represents the historical period used as a reference for calculating the average candlestick height.
Period To Check:
- The recent period during which the indicator checks for uniformity in candle color and calculates the average candlestick height.
Candle Power Threshold:
- Defines the threshold level for candlestick power. Only candles with power greater than this threshold contribute to signal generation.
Signal Generation:
Buy Signal:
- A Buy signal is generated when a specified number of consecutive green candles are detected, and the candlestick power exceeds the defined threshold.
Sell Signal:
- A Sell signal is generated when a specified number of consecutive red candles are detected, and the candlestick power exceeds the defined threshold.
How to Use:
Adding the Indicator:
- Add the "Similar candle color combine by candle power" indicator to your cAlgo platform.
Adjusting Parameters:
- Customize the indicator parameters such as "Candles Count," "Period Reference," "Period To Check," and "Candle Power Threshold" based on your trading strategy.
Interpreting Signals:
- When the indicator generates a Buy signal, it indicates a potential bullish trend, and when it generates a Sell signal, it suggests a potential bearish trend.
Confirmation:
- Consider using additional confirmation tools or technical analysis to validate the signals generated by the indicator.
Backtesting:
- Before applying the indicator in live trading, perform backtesting on historical data to assess its performance and refine parameters if needed.
Remember that trading involves risk, and it's crucial to use proper risk management techniques and combine multiple indicators/strategies for a comprehensive analysis.

Best regards, Dr.khashix." i love you all
using System;
using cAlgo.API;
using cAlgo.API.Indicators;

namespace cAlgo
{
    [Indicator(IsOverlay = true, TimeZone = TimeZones.UTC, AccessRights = AccessRights.None)]
    public class Similarcandlecolorcandelpower : Indicator
    {
        public enum Signals
        {
            None,
            Buy,
            Sell
        }

        [Output("Buy", Color = Colors.White, Thickness = 7, PlotType = PlotType.Points)]
        public IndicatorDataSeries BuyIndicator { get; set; }

        [Output("Sell", Color = Colors.RoyalBlue, Thickness = 7, PlotType = PlotType.Points)]
        public IndicatorDataSeries SellIndicator { get; set; }

        [Parameter("Candles Count", DefaultValue = 3)]
        public int CandlesCount { get; set; }

        [Parameter("Period Reference", DefaultValue = 100, MinValue = 1)]
        public int PeriodReference { get; set; }

        [Parameter("Period To Check", DefaultValue = 3, MinValue = 1)]
        public int PeriodToCheck { get; set; }

        [Parameter("Candle Power Threshold", DefaultValue = 2)]
        public double CandlePowerThreshold { get; set; }

        private Signals lastSignal = Signals.None;
        private int consecutiveGreenCandles = 0;
        private int consecutiveRedCandles = 0;

        public override void Calculate(int index)
        {
            if (index < Math.Max(CandlesCount, Math.Max(PeriodReference, PeriodToCheck)))
                return;

            double sumCandleHeightReference = 0;
            double sumCandleHeightToCheck = 0;

            for (int i = 0; i < PeriodReference; i++)
                sumCandleHeightReference += MarketSeries.High[index - i] - MarketSeries.Low[index - i];

            for (int i = 0; i < PeriodToCheck; i++)
                sumCandleHeightToCheck += MarketSeries.High[index - i] - MarketSeries.Low[index - i];

            double averageCandleHeightReference = sumCandleHeightReference / PeriodReference;
            double averageCandleHeightToCheck = sumCandleHeightToCheck / PeriodToCheck;

            double candlePower = averageCandleHeightToCheck / averageCandleHeightReference;

            // Use candlePower in signal generation as a filter
            if (IsGreenCandles(index))
            {
                consecutiveGreenCandles++;

                if (consecutiveGreenCandles == CandlesCount && lastSignal != Signals.Buy && candlePower > CandlePowerThreshold)
                {
                    BuyIndicator[index] = MarketSeries.Low[index] - Symbol.PipSize;
                    lastSignal = Signals.Buy;
                    SellIndicator[index] = double.NaN;
                }
                else
                {
                    SellIndicator[index] = double.NaN;
                }

                consecutiveRedCandles = 0;
            }
            else if (IsRedCandles(index))
            {
                consecutiveRedCandles++;

                if (consecutiveRedCandles == CandlesCount && lastSignal != Signals.Sell && candlePower > CandlePowerThreshold)
                {
                    SellIndicator[index] = MarketSeries.High[index] + Symbol.PipSize;
                    lastSignal = Signals.Sell;
                    BuyIndicator[index] = double.NaN;
                }
                else
                {
                    BuyIndicator[index] = double.NaN;
                }

                consecutiveGreenCandles = 0;
            }
            else
            {
                consecutiveGreenCandles = 0;
                consecutiveRedCandles = 0;
                BuyIndicator[index] = double.NaN;
                SellIndicator[index] = double.NaN;
            }
        }

        private bool IsGreenCandles(int index)
        {
            return MarketSeries.Close[index] > MarketSeries.Open[index];
        }

        private bool IsRedCandles(int index)
        {
            return MarketSeries.Close[index] < MarketSeries.Open[index];
        }
    }
}
drkhashix
Joined on 12.02.2023
- Distribution: Free
- Language: C#
- Trading platform: cTrader Automate
- File name: Similar candle color combine by candel power.algo
- Rating: 5
- Installs: 646
- Modified: 21/11/2023 17:25
Comments
parameter not bad: 3 50 3 1.5
In order, i.e. 3 candles in a row among the last 50 candles, if the size of those 3 candles is more than the average, a signal will be placed according to the formula 1.5

After trying to plot indicator, I got the following message: Solution?