Description
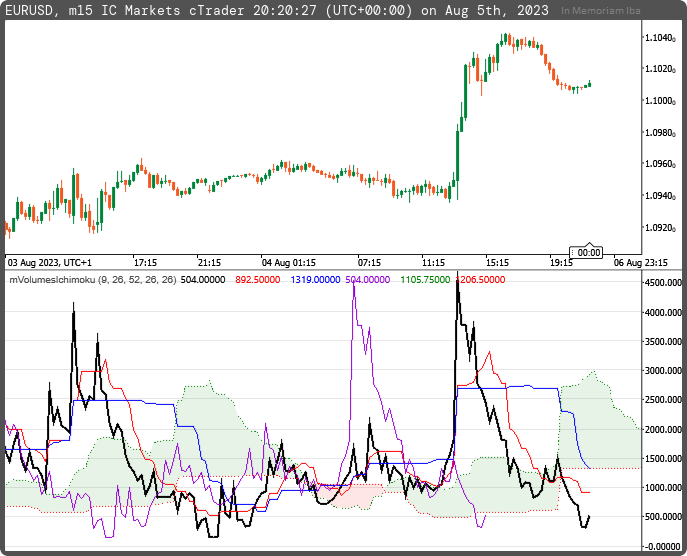
This custom indicator is a Price Volume Analysis indicator.
The analysis of volume is expressed through the well-known indicator, Ichimoku.
This indicator is most commonly used to identify zones when the volume is pronounced, and to trade using large bars. Additionally, this indicator does not show the direction of price.
Interpreting Price Volume through the Ichimoku Kinkō Hyō indicator can potentially provide useful information for trading financial instruments. The Ichimoku Kinkō Hyō, often referred to simply as Ichimoku Cloud, is a comprehensive technical analysis tool that incorporates multiple components to offer insights into trends, support and resistance levels, and potential trading opportunities. While the Ichimoku Cloud is primarily focused on price action, it does not directly include volume in its calculations. However, combining the Ichimoku Cloud with volume analysis can lead to a more comprehensive trading strategy. Here's how you might approach this:
Price Action Analysis with Ichimoku Cloud: The Ichimoku Cloud consists of several components, including the Kumo (cloud), Tenkan-sen (Conversion Line), Kijun-sen (Base Line), Chikou Span (Lagging Span), and Senkou Span A and B (Leading Spans). These elements help identify trends, support/resistance levels, and potential reversal points. By analyzing these components along with price action, you can make informed trading decisions.
Volume Analysis: While the Ichimoku Cloud itself doesn't incorporate volume, you can consider volume analysis alongside it. Volume can provide insights into the strength of price movements. For example, high volume during a breakout from the cloud or during a reversal could indicate the potential for a significant price movement. Conversely, low volume during consolidation might suggest a lack of conviction in the current trend.
Combining Price and Volume: You can integrate volume analysis into your overall trading strategy by using it to confirm signals provided by the Ichimoku Cloud. For instance, if the cloud signals a potential trend change (e.g., a bullish crossover of Tenkan-sen and Kijun-sen), a higher volume accompanying the move could reinforce the validity of the signal.
Consider Additional Indicators: To enhance your analysis further, you might consider using other technical indicators that incorporate both price and volume, such as the On-Balance Volume (OBV) indicator or the Chaikin Money Flow indicator. These indicators can provide insights into the relationship between price movements and trading volumes.
Remember that no single indicator can guarantee successful trading outcomes. It's important to use a combination of indicators and analysis methods to build a well-rounded trading strategy. Additionally, always practice risk management and consider factors beyond technical analysis, such as fundamental analysis and market sentiment, when making trading decisions.

mfejza
Joined on 25.01.2022
- Distribution: Free
- Language: C#
- Trading platform: cTrader Automate
- File name: mVolumeIchimoku.algo
- Rating: 5
- Installs: 664
- Modified: 05/08/2023 20:31
