Category Trend  Published on 30/07/2023

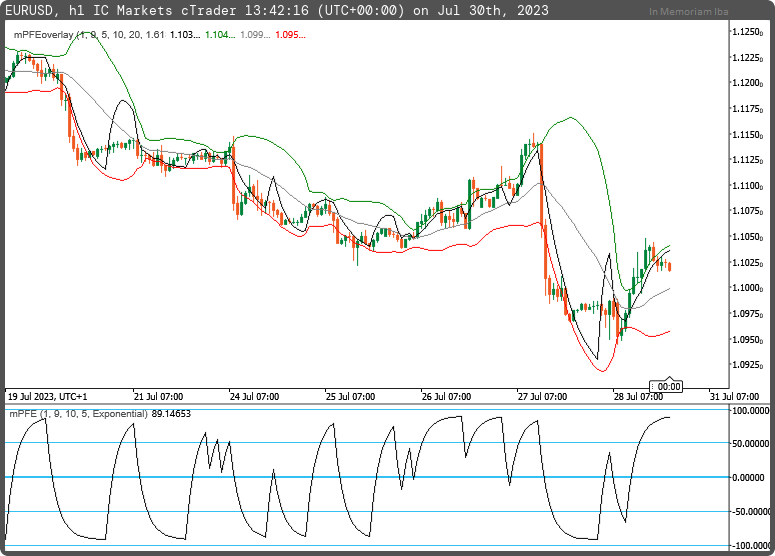
Polarized Fractal Efficiency indicator

An update for this algorithm is currently pending moderation. Please revisit this page shortly to access the algorithm's latest version.
Description

The term polarized fractal efficiency (PFE) refers to a technical indicator that is used to determine the price efficiency for an investment over a user-defined period. It fluctuates between -100 and 100 where the centerline is at zero. Traders can use the PFE to see where a security they're interested in is headed. The price shows an upward trend if the PFE goes above zero and a downward trend if it drops below zero. The indicator was developed by author, engineer, programmer, and trader Hans Hannula.

The polarized fractal efficiency indicator was developed by author, engineer, programmer, and trader Hans Hannula. The idea was first mentioned in 1994 in the January issue of Technical Analysis of Stocks & Commodities magazine. It fluctuates between -100 and +100, with zero as the centerline. Securities with a PFE greater than zero trend up, while a reading of less than zero indicates a downward trend.

The PFE indicator measures the strength of a trend by its position relative to the zero line. As a general rule, the further the PFE value is away from zero, the stronger and more efficient the given trend is. A PFE value that fluctuates around the zero line could indicate that the supply and demand for the security are in balance and the price may trade sideways.

Strategies that generally use the PFE as a signal consider a buy sign as a reversal in the direction of the indicator and its movement from its minimum value to zero. A signal to close a position arises as the value of the indicator reaches its peak above zero. An indicator shift from peak to zero presents a sell signal. As a rule of thumb, traders should buy to cover all short positions after the indicator forms a new minimum.

In this link you can find the indicator as oscillator indicator: https://ctrader.com/algos/indicators/show/3529


mfejza's avatar
mfejza

Joined on 25.01.2022

  • Distribution: Free
  • Language: C#
  • Trading platform: cTrader Automate
  • File name: mPFEoverlay.algo
  • Rating: 5
  • Installs: 540
  • Modified: 30/07/2023 13:52
Comments
Log in to add a comment.
mfejza's avatar
mfejza · 1 year ago
using System;
using cAlgo.API;
using cAlgo.API.Indicators;
using cAlgo.API.Internals;

namespace cAlgo
{
    [Indicator(IsOverlay = true, AccessRights = AccessRights.None)]
    public class mPFEb : Indicator
    {
        [Parameter("Fast ROC Period (1)", DefaultValue = 1)]
        public int inpFastROCperiod { get; set; }
        [Parameter("Slow ROC Period (9)", DefaultValue = 9)]
        public int inpSlowROCperiod { get; set; }
        [Parameter("Smooth Period (5)", DefaultValue = 5)]
        public int inpSmoothPeriod { get; set; }
        [Parameter("PDS (10)", DefaultValue = 10)]
        public int inpPDS { get; set; }
        [Parameter("Bands Periods (20)", DefaultValue = 20)]
        public int inpBandsPeriods { get; set; }
        [Parameter("Bands Deviation (1.618)", DefaultValue = 1.618)]
        public double inpBandsDeviation { get; set; }

        [Output("PFE", LineColor = "Black", LineStyle = LineStyle.Solid, Thickness = 1)]
        public IndicatorDataSeries outPFE { get; set; }
        [Output("BB Up", LineColor = "Green", PlotType = PlotType.Line, Thickness = 1)]
        public IndicatorDataSeries outBBup { get; set; }
        [Output("BB Mid", LineColor = "Gray", PlotType = PlotType.Line, Thickness = 1)]
        public IndicatorDataSeries outBBmid { get; set; }
        [Output("BB Down", LineColor = "Red", PlotType = PlotType.Line, Thickness = 1)]
        public IndicatorDataSeries outBBdown { get; set; }
        
        private IndicatorDataSeries _rocfast, _rocslow, _polarizedefficiency, _raw, _scale;
        private BollingerBands _bbands;
        private MovingAverage _pfe;
        

        protected override void Initialize()
        {
            _rocfast = CreateDataSeries();
            _rocslow = CreateDataSeries();
            _polarizedefficiency = CreateDataSeries();
            _raw = CreateDataSeries();
            _bbands = Indicators.BollingerBands(Bars.ClosePrices, inpBandsPeriods, inpBandsDeviation, MovingAverageType.Simple);
            _pfe = Indicators.MovingAverage(_raw, inpSmoothPeriod, MovingAverageType.Exponential);
            _scale = CreateDataSeries();
        }

        public override void Calculate(int i)
        {
            _rocfast[i] = i>inpFastROCperiod 
                        ? (Bars.ClosePrices[i-inpFastROCperiod] != 0 ? 100.0 * (Bars.ClosePrices[i] / Bars.ClosePrices[i-inpFastROCperiod] - 1) : 0)
                        : (Bars.TypicalPrices[i] != 0 ? 100.0 * (Bars.ClosePrices[i] / Bars.TypicalPrices[i] - 1) : 0);
            _rocslow[i] = i>inpSlowROCperiod 
                        ? (Bars.ClosePrices[i-inpSlowROCperiod] != 0 ? 100.0 * (Bars.ClosePrices[i] / Bars.ClosePrices[i-inpSlowROCperiod] - 1) : 0)
                        : (Bars.TypicalPrices[i] != 0 ? 100.0 * (Bars.ClosePrices[i] / Bars.TypicalPrices[i] - 1) : 0);
            _polarizedefficiency[i] = Math.Sqrt(_rocslow[i] * _rocslow[i] + 100.0) / ((Math.Sqrt(_rocfast[i] * _rocfast[i] + 1.0) + inpPDS)!=0 ? Math.Sqrt(_rocfast[i] * _rocfast[i] + 1.0) + inpPDS : 1);
            _raw[i] = (Bars.ClosePrices[i] > (i>inpSlowROCperiod ? Bars.ClosePrices[i-inpSlowROCperiod] : Bars.TypicalPrices[i]) ? 100.0 * _polarizedefficiency[i] : -100.0 * _polarizedefficiency[i]);
            _scale[i] = (_bbands.Top[i] != _bbands.Bottom[i] ? 200.0/(_bbands.Top[i]-_bbands.Bottom[i]) : 0);

            outPFE[i] = (_scale[i] != 0 ? _bbands.Bottom[i] +(100.0 + _pfe.Result[i]) / _scale[i] : double.NaN); // _pfe.Result[i];
            outBBup[i] = _bbands.Top[i];
            outBBmid[i] = _bbands.Main[i];
            outBBdown[i] = _bbands.Bottom[i];
        }
    }
}