Description
Auto Trendlines with Retest.
Can apply on Price chart, or any Indicator chart.
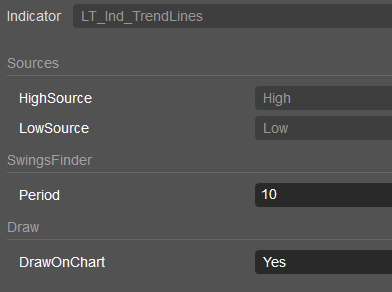
HighSource: source for finding Maxima.
LowSource: source for finding Minima.
Period: Period for finding local Extrema.
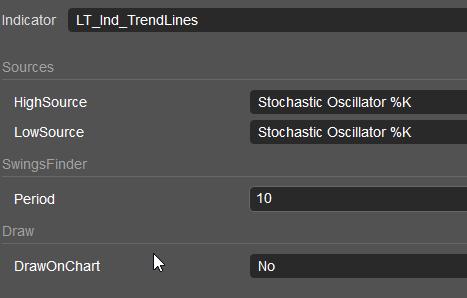
DrawOnChart: Yes if you want trend lines on price. No for indicator (The HighSource and LowSource must be selected to indicators).
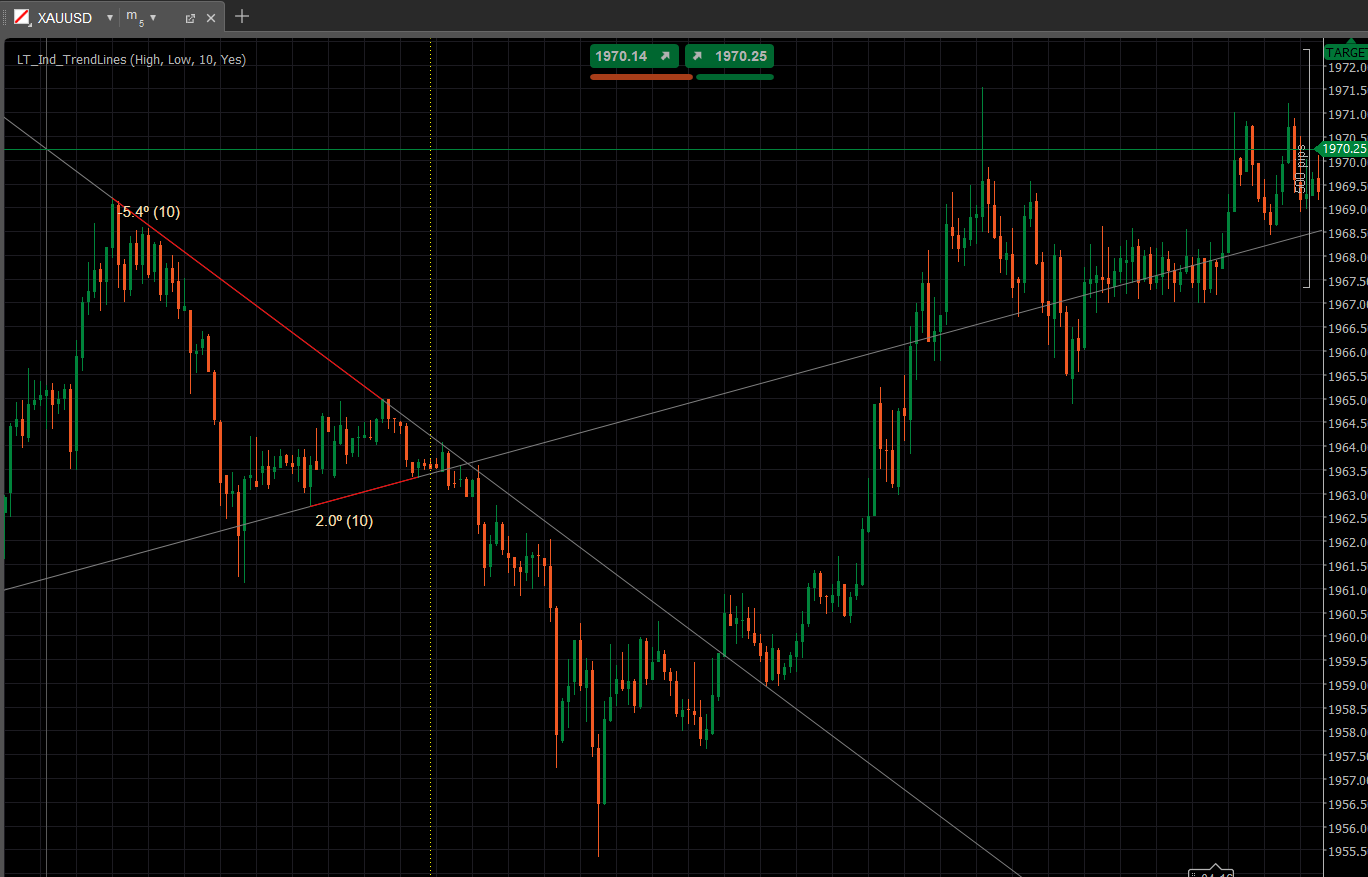
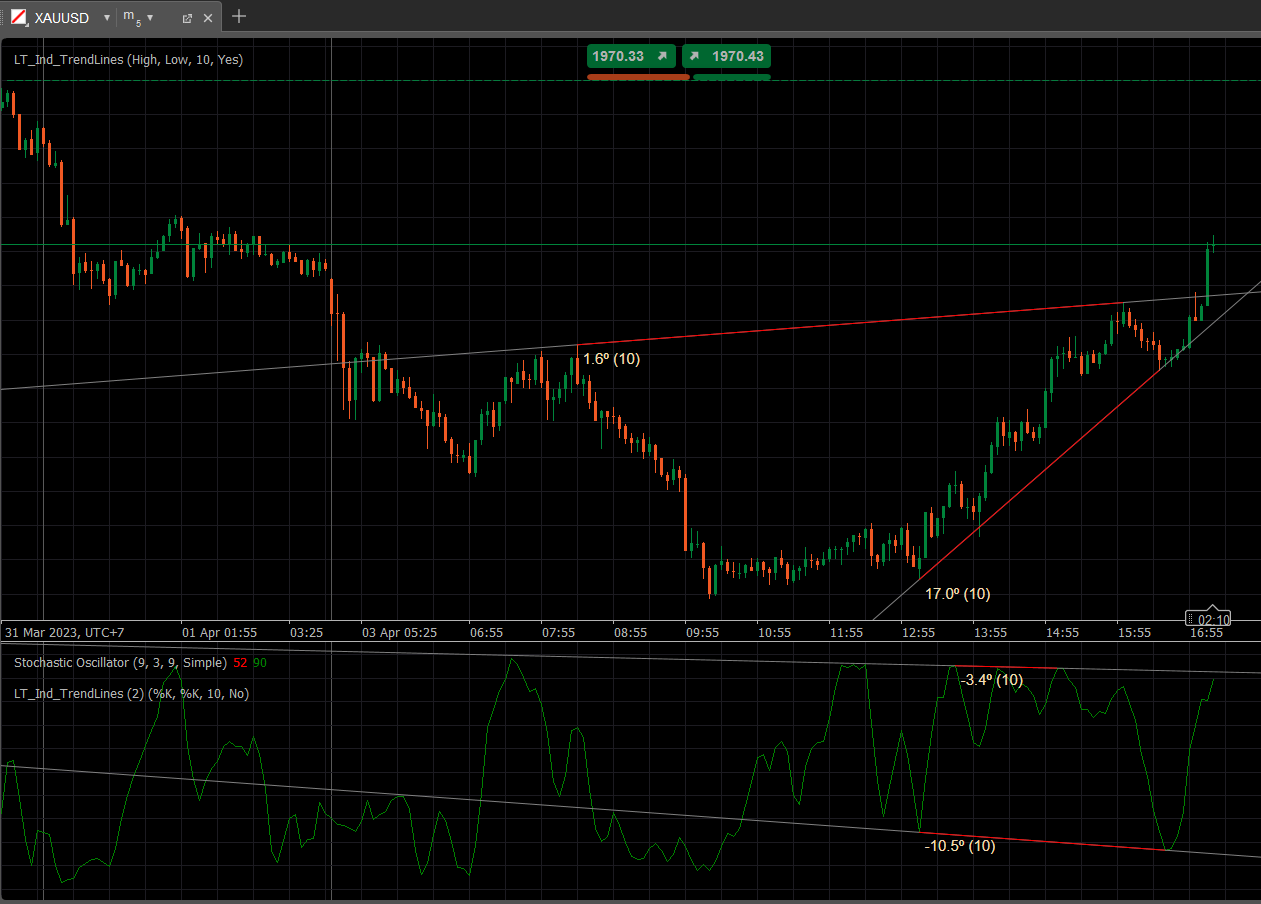
Ctrl click on a place on Chart to do retest. When retest active, a vertical dot yellow line appears, drag the line to move retest. Press delete to delete the retest and switch to live mode.
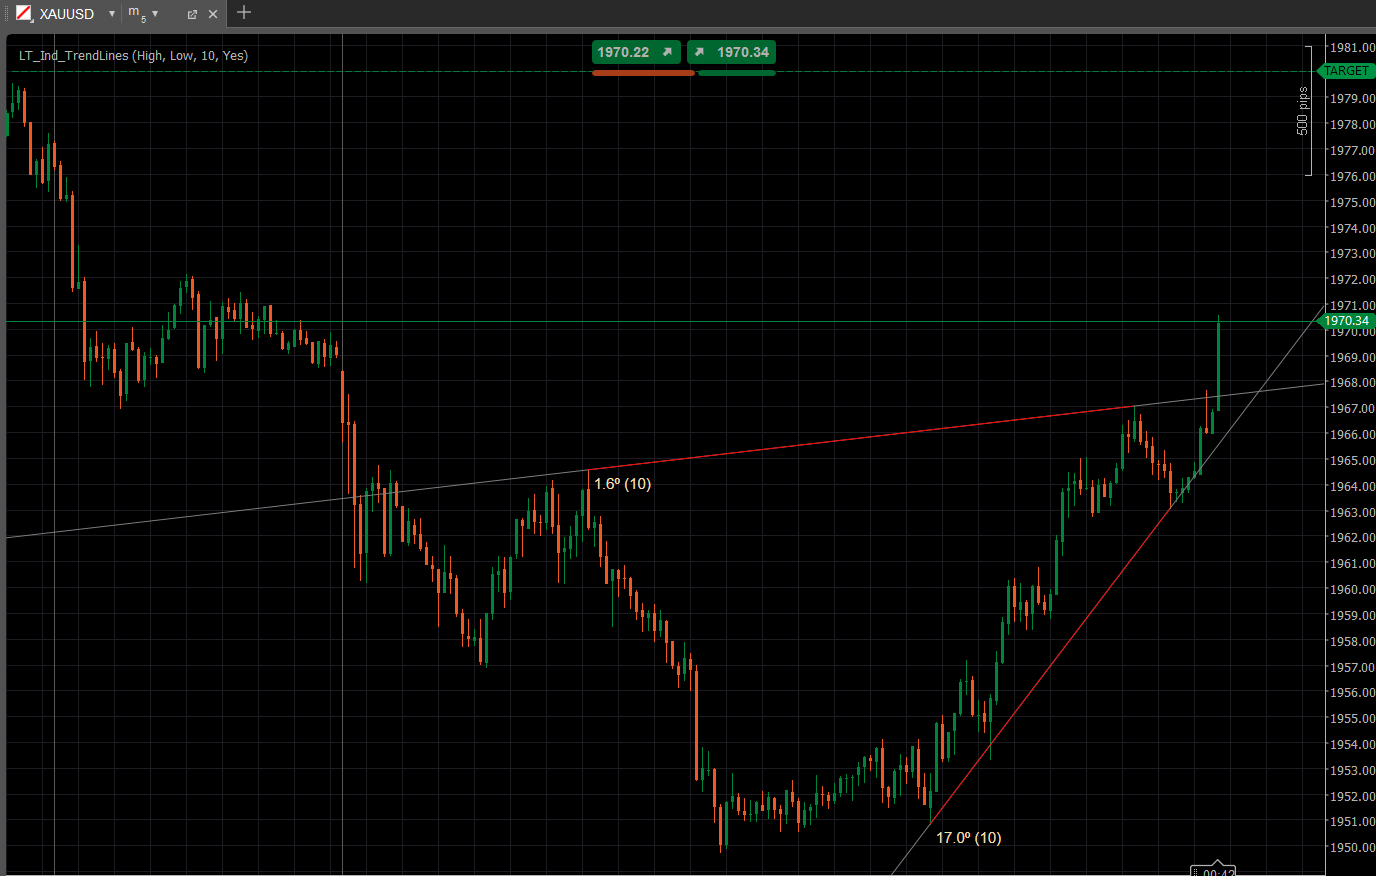
The display beside each trendline are the angle and the period. Angle (Period).
Retest in action:
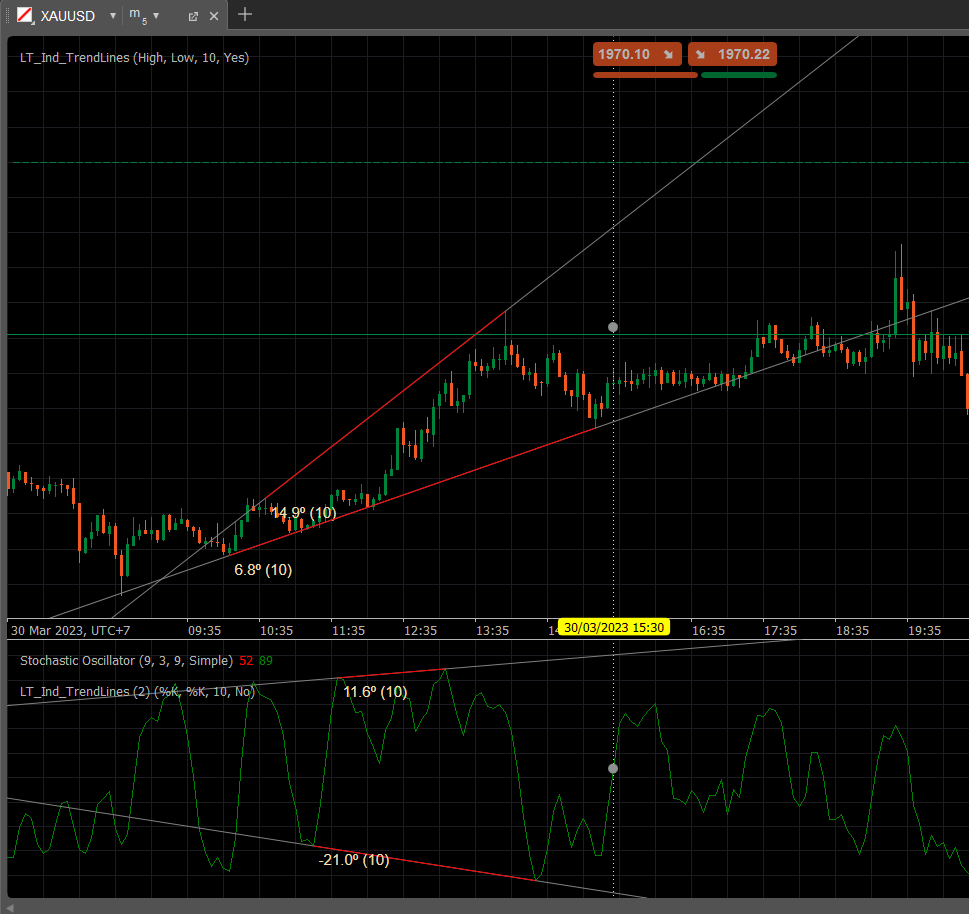
Add Trendline for Stochastic Osc:
In action:
retest can go together:
using System;
using cAlgo.API;
using cAlgo.API.Indicators;
using LittleTrader;
using LittleTrader.Models.PriceActions;
using LittleTrader.Extensions;
using System.Collections.Generic;

namespace cAlgo.Indicators
{
    [Indicator(IsOverlay = true, AccessRights = AccessRights.None)]
    public class LT_Ind_TrendLines : Indicator
    {
        [Parameter(Group = "Sources")]
        public DataSeries HighSource { get; set; }
        [Parameter(Group = "Sources")]
        public DataSeries LowSource { get; set; }

        [Parameter(DefaultValue = 20, MinValue = 1, Group = "SwingsFinder")]
        public int Period { get; set; }

        [Parameter(DefaultValue = true, Group = "Draw")]
        public bool DrawOnChart { get; set; }

        ChartVerticalLine _shiftLine;
        DateTime _lastShiftLineTime;
        protected override void Initialize()
        {
            Chart.ObjectsUpdated += e =>
            {
                if (_shiftLine != null && _shiftLine.Time != _lastShiftLineTime)
                {
                    _lastShiftLineTime = _shiftLine.Time;
                    var index = Bars.OpenTimes.GetIndexByTime(_shiftLine.Time);
                    RetestAt(index);
                }
            };

            Chart.MouseDown += e =>
            {
                if (e.CtrlKey == true)
                {
                    var index = (int)e.BarIndex;
                    DrawShiftLine(index);
                    RetestAt(index);
                }
            };

            Chart.ObjectsRemoved += e =>
            {
                if (e.ChartObjects[0] == _shiftLine)
                {
                    _shiftLine = null;
                    Print("Shift line removed!");
                    Calculate(Bars.GetLastIndex());
                }
            };
        }

        void RetestAt(int index)
        {
            CalTrendlines(index, true);
            Print("Retest at {0}", index);
        }

        void DrawShiftLine(int index)
        {
            _shiftLine = Chart.DrawVerticalLine("shift", index, Color.Yellow, 1, LineStyle.DotsRare);
            _shiftLine.IsInteractive = true;
        }

        public override void Calculate(int index)
        {
            if (_shiftLine != null) return;
            try
            {
                CalTrendlines(index);
            }
            catch (LTNoDataException)
            {
            }
            catch (Exception ex)
            {
                Print(ex.ToString());
            }
        }

        class TrendData
        {
            public DataSeries High { get; set; }
            public DataSeries Low { get; set; }
            public ChartArea Chart { get; set; }
        }

        void CalTrendlines(int index, bool retest = false)
        {
            var list = new List<TrendData>
            {
                new TrendData { High = HighSource, Low = LowSource, Chart = DrawOnChart ? (ChartArea)Chart : IndicatorArea },
            };

            try
            {
                foreach (var item in list)
                {
                    var high = new Trendline(item.High, Swings.High, Period, index);
                    var low = new Trendline(item.Low, Swings.Low, Period, index);
                    high.Draw(item.Chart, "high", 200);
                    low.Draw(item.Chart, "low", 200);
                }
            }

            catch (LTNoDataException)
            { }
        }

    }
}
dhnhuy
Joined on 03.04.2023
- Distribution: Free
- Language: C#
- Trading platform: cTrader Automate
- File name: LT_Ind_TrendLines.algo
- Rating: 5
- Installs: 1951
- Modified: 03/04/2023 10:19
Comments
interessante parabéns
nice job
Correction Dots and arrows on the plattform.
Iam new i just migrated from mt4 due to it had to many limitations. I Wonder how you add indicators to the same windows. And previous user is right it needs thicker lines. I Also noticed dots and arrows on this indicator aswell as lines are way to small. Man i miss my indicators my first day with c trader on a demo i will try to convert as many of my old favorites when i get to know the plattform abit better
Hi, is it possible to change color of the line that currently is red? Also, is it possible to increase size of these grey lines? Thanks!
WO

HI man ,i want to know more about LittleTrader library , Can i have you email or any other way of communication i want to buit somo custom logic ,need you halp. i am leaving my email plz drop an email when ever you read my comment
usmanbabar123@gmail.com