Warning! This section will be deprecated on February 1st 2025. Please move all your Indicators to the cTrader Store catalogue.
Description
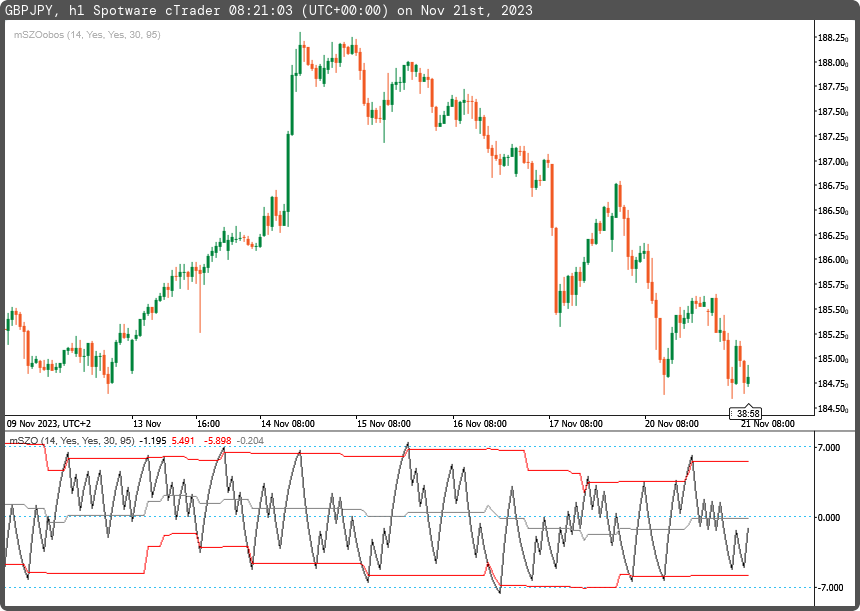
The SZO (Sentiment Zone Oscillator) indicator shows the market sentiment (activity and direction) and zones of excessive activity (overbought/oversold zones). It can display a dynamic channel, beyond which deals are seen as undesirable because of the high probability of a change in sentiment and of reversal.
If the indicator line moves beyond the channel and at the same time enters the overbought/oversold zone, this may mean that the market trend can change soon. The indicator often warns of such a possible change in advance, so it is advisable to use it in combination with another confirmation indicator.

using System;
using cAlgo.API;
using cAlgo.API.Collections;
using cAlgo.API.Indicators;
using cAlgo.API.Internals;

namespace cAlgo
{
    [Levels(0, -7, +7)]
    [Indicator(IsOverlay = false, AccessRights = AccessRights.None)]
    public class mSZO : Indicator
    {
        [Parameter("Period SZO (14)", DefaultValue = 14)]
        public int inpPeriodSZO { get; set; }
        [Parameter("Show Levels (yes)", DefaultValue = true)]
        public bool inpShowDLev { get; set; }
        [Parameter("Show Mid Level (yes)", DefaultValue = true)]
        public bool inpShowMidLev { get; set; }
        [Parameter("Period Levels  (30)", DefaultValue = 30)]
        public int inpPeriodLevels { get; set; }
        [Parameter("Percent Level (95.0)", DefaultValue = 95.0)]
        public double inpPercentLevel { get; set; }

        [Output("SZO", IsHistogram = false, LineColor = "Black", PlotType = PlotType.Line, LineStyle = LineStyle.Solid, Thickness = 1)]
        public IndicatorDataSeries outSZO { get; set; }
        [Output("Top", IsHistogram = false, LineColor = "Red", PlotType = PlotType.Line, LineStyle = LineStyle.Solid, Thickness = 1)]
        public IndicatorDataSeries outTop { get; set; }
        [Output("Bottom", IsHistogram = false, LineColor = "Red", PlotType = PlotType.Line, LineStyle = LineStyle.Solid, Thickness = 1)]
        public IndicatorDataSeries outBottom { get; set; }
        [Output("Middle", IsHistogram = false, LineColor = "Gray", PlotType = PlotType.Line, LineStyle = LineStyle.Solid, Thickness = 1)]
        public IndicatorDataSeries outMiddle { get; set; }

        private IndicatorDataSeries _score, _szo, _hhlvl, _lllvl, _range, _rangeproc;
        private ExponentialMovingAverage _smooth1, _smooth2, _smooth3;


        protected override void Initialize()
        {
            _score = CreateDataSeries();
            _szo = CreateDataSeries();
            _hhlvl = CreateDataSeries();
            _lllvl = CreateDataSeries();
            _range = CreateDataSeries();
            _rangeproc = CreateDataSeries();
            _smooth1 = Indicators.ExponentialMovingAverage(_score, inpPeriodSZO);
            _smooth2 = Indicators.ExponentialMovingAverage(_smooth1.Result, inpPeriodSZO);
            _smooth3 = Indicators.ExponentialMovingAverage(_smooth2.Result, inpPeriodSZO);
        }

        public override void Calculate(int i)
        {
            _score[i] = (i>1 && Bars.ClosePrices[i] > Bars.ClosePrices[i-1] ? +1 : -1);
            _szo[i] = 100.0 * ((3 * _smooth1.Result[i] - 3 * _smooth2.Result[i] + _smooth3.Result[i]) / inpPeriodSZO);
            _hhlvl[i] = _szo.Maximum(inpPeriodLevels);
            _lllvl[i] = _szo.Minimum(inpPeriodLevels);
            _range[i] = _hhlvl[i] - _lllvl[i];
            _rangeproc[i] = _range[i] * (inpPercentLevel / 100.0);

            outSZO[i] = _szo[i];
            outTop[i] = inpShowDLev ? _lllvl[i] + _rangeproc[i] : double.NaN;
            outBottom[i] = inpShowDLev ? _hhlvl[i] - _rangeproc[i] : double.NaN;
            outMiddle[i] = inpShowDLev && inpShowMidLev ? (_lllvl[i] + _rangeproc[i] + _hhlvl[i] - _rangeproc[i]) / 2 : double.NaN;
        }
    }
}
mfejza
Joined on 25.01.2022
- Distribution: Free
- Language: C#
- Trading platform: cTrader Automate
- File name: mSZO.algo
- Rating: 0
- Installs: 421
- Modified: 21/11/2023 08:21
Note that publishing copyrighted material is strictly prohibited. If you believe there is copyrighted material in this section, please use the Copyright Infringement Notification form to submit a claim.
Comments
Log in to add a comment.
No comments found.
