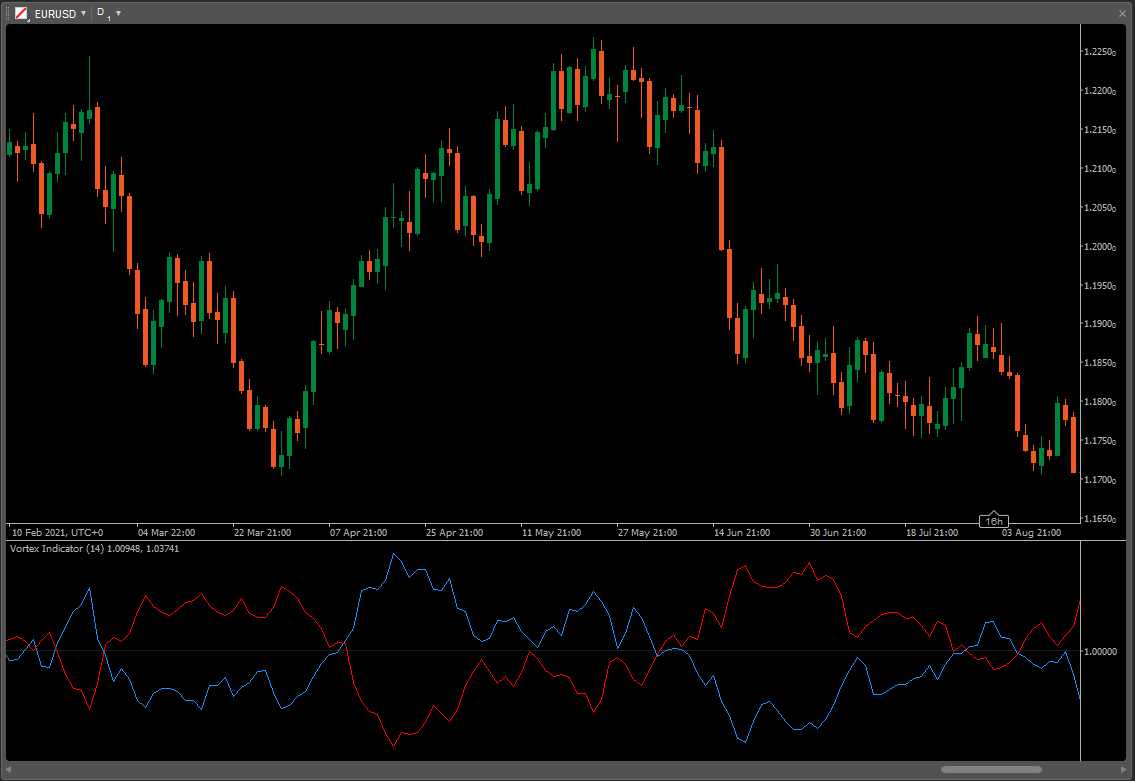
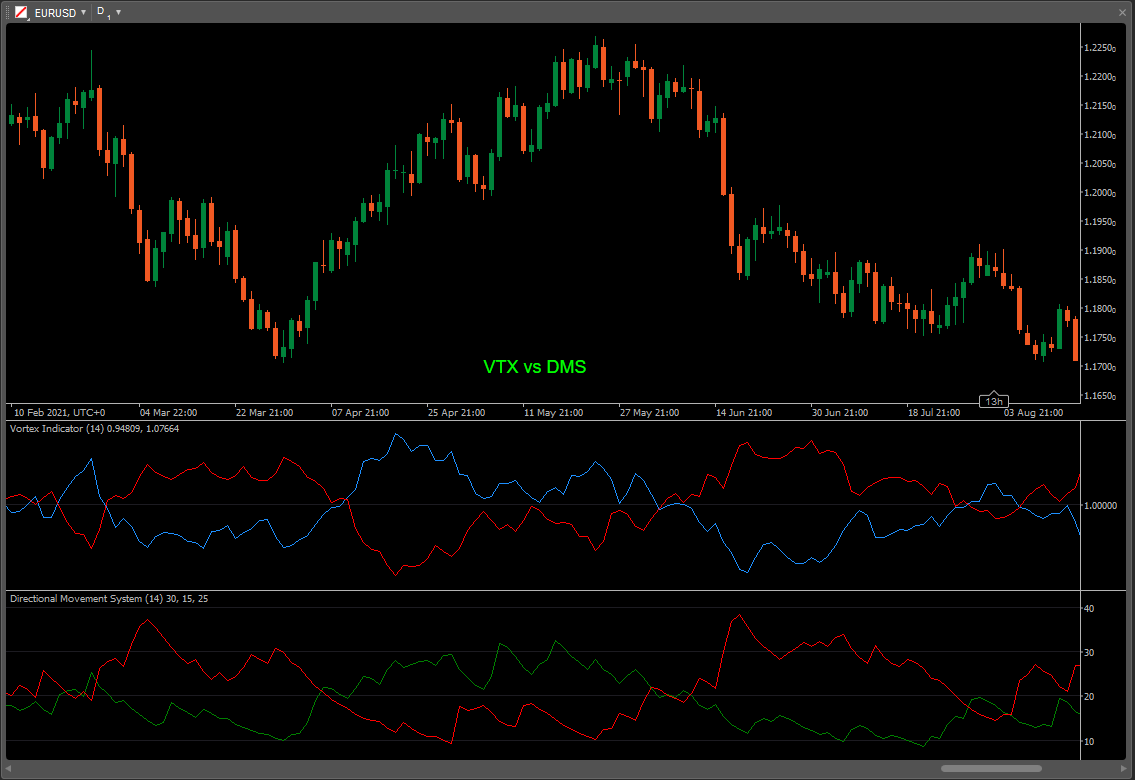
Description
Developed by Etienne Botes and Douglas Siepman, the Vortex Indicator consists of two oscillators that capture positive and negative trend movement. In creating this indicator, Botes and Seipman drew on the work of Welles Wilder and Viktor Schauberger, who is considered the father of implosion technology. Despite a rather involved formula, the indicator is quite easy to interpret. A bullish signal triggers when the positive trend indicator crosses above the negative trend indicator or a key level. A bearish signal triggers when the negative trend indicator crosses above the positive trend indicator or a key level. The Vortex Indicator is either above or below these levels, which means it always has a clear bullish or bearish bias.


Github: GitHub - Doustzadeh/cTrader-Indicator
using System;
using cAlgo.API;

namespace cAlgo
{
    [Levels(1)]
    [Indicator(IsOverlay = false, AccessRights = AccessRights.None)]
    public class VortexIndicator : Indicator
    {
        // Positive and negative trend movement:
        // +VM = Current High less Prior Low (absolute value)
        // -VM = Current Low less Prior High (absolute value)

        // +VM14 = 14-period Sum of +VM
        // -VM14 = 14-period Sum of -VM

        // True Range (TR) is the greatest of:
        //   * Current High less current Low
        //   * Current High less previous Close (absolute value)
        //   * Current Low less previous Close (absolute value)

        // TR14 = 14-period Sum of TR

        // Normalize the positive and negative trend movements:
        // +VI14 = +VM14/TR14
        // -VI14 = -VM14/TR14

        [Parameter("Periods", DefaultValue = 14)]
        public int Periods { get; set; }

        [Output("+VI", LineColor = "DodgerBlue")]
        public IndicatorDataSeries PlusVI { get; set; }

        [Output("-VI", LineColor = "Red")]
        public IndicatorDataSeries MinusVI { get; set; }

        private IndicatorDataSeries PlusVM, MinusVM, TR;

        protected override void Initialize()
        {
            PlusVM = CreateDataSeries();
            MinusVM = CreateDataSeries();
            TR = CreateDataSeries();
        }

        public override void Calculate(int index)
        {
            PlusVM[index] = Math.Abs(Bars.HighPrices[index] - Bars.LowPrices[index - 1]);
            MinusVM[index] = Math.Abs(Bars.LowPrices[index] - Bars.HighPrices[index - 1]);

            TR[index] = Math.Max(Bars.HighPrices[index] - Bars.LowPrices[index], Math.Max(Math.Abs(Bars.HighPrices[index] - Bars.ClosePrices[index - 1]), Math.Abs(Bars.LowPrices[index] - Bars.ClosePrices[index - 1])));

            double SumPlusVM = PlusVM.Sum(Periods);
            double SumMinusVM = MinusVM.Sum(Periods);

            double SumTR = TR.Sum(Periods);

            PlusVI[index] = SumPlusVM / SumTR;
            MinusVI[index] = SumMinusVM / SumTR;
        }
    }
}
Doustzadeh
Joined on 20.03.2016
- Distribution: Free
- Language: C#
- Trading platform: cTrader Automate
- File name: Vortex Indicator.algo
- Rating: 5
- Installs: 1686
- Modified: 07/12/2021 06:01
Comments
Maybe you can try to use ChatGPT to help you with your work, hope and help you.

Through the whirlpool indicator, I can sometimes see the rise and fall of some stocks, but it is still very difficult for me, and I am Janitor AI not very sure.