Warning! This section will be deprecated on February 1st 2025. Please move all your Indicators to the cTrader Store catalogue.
Description
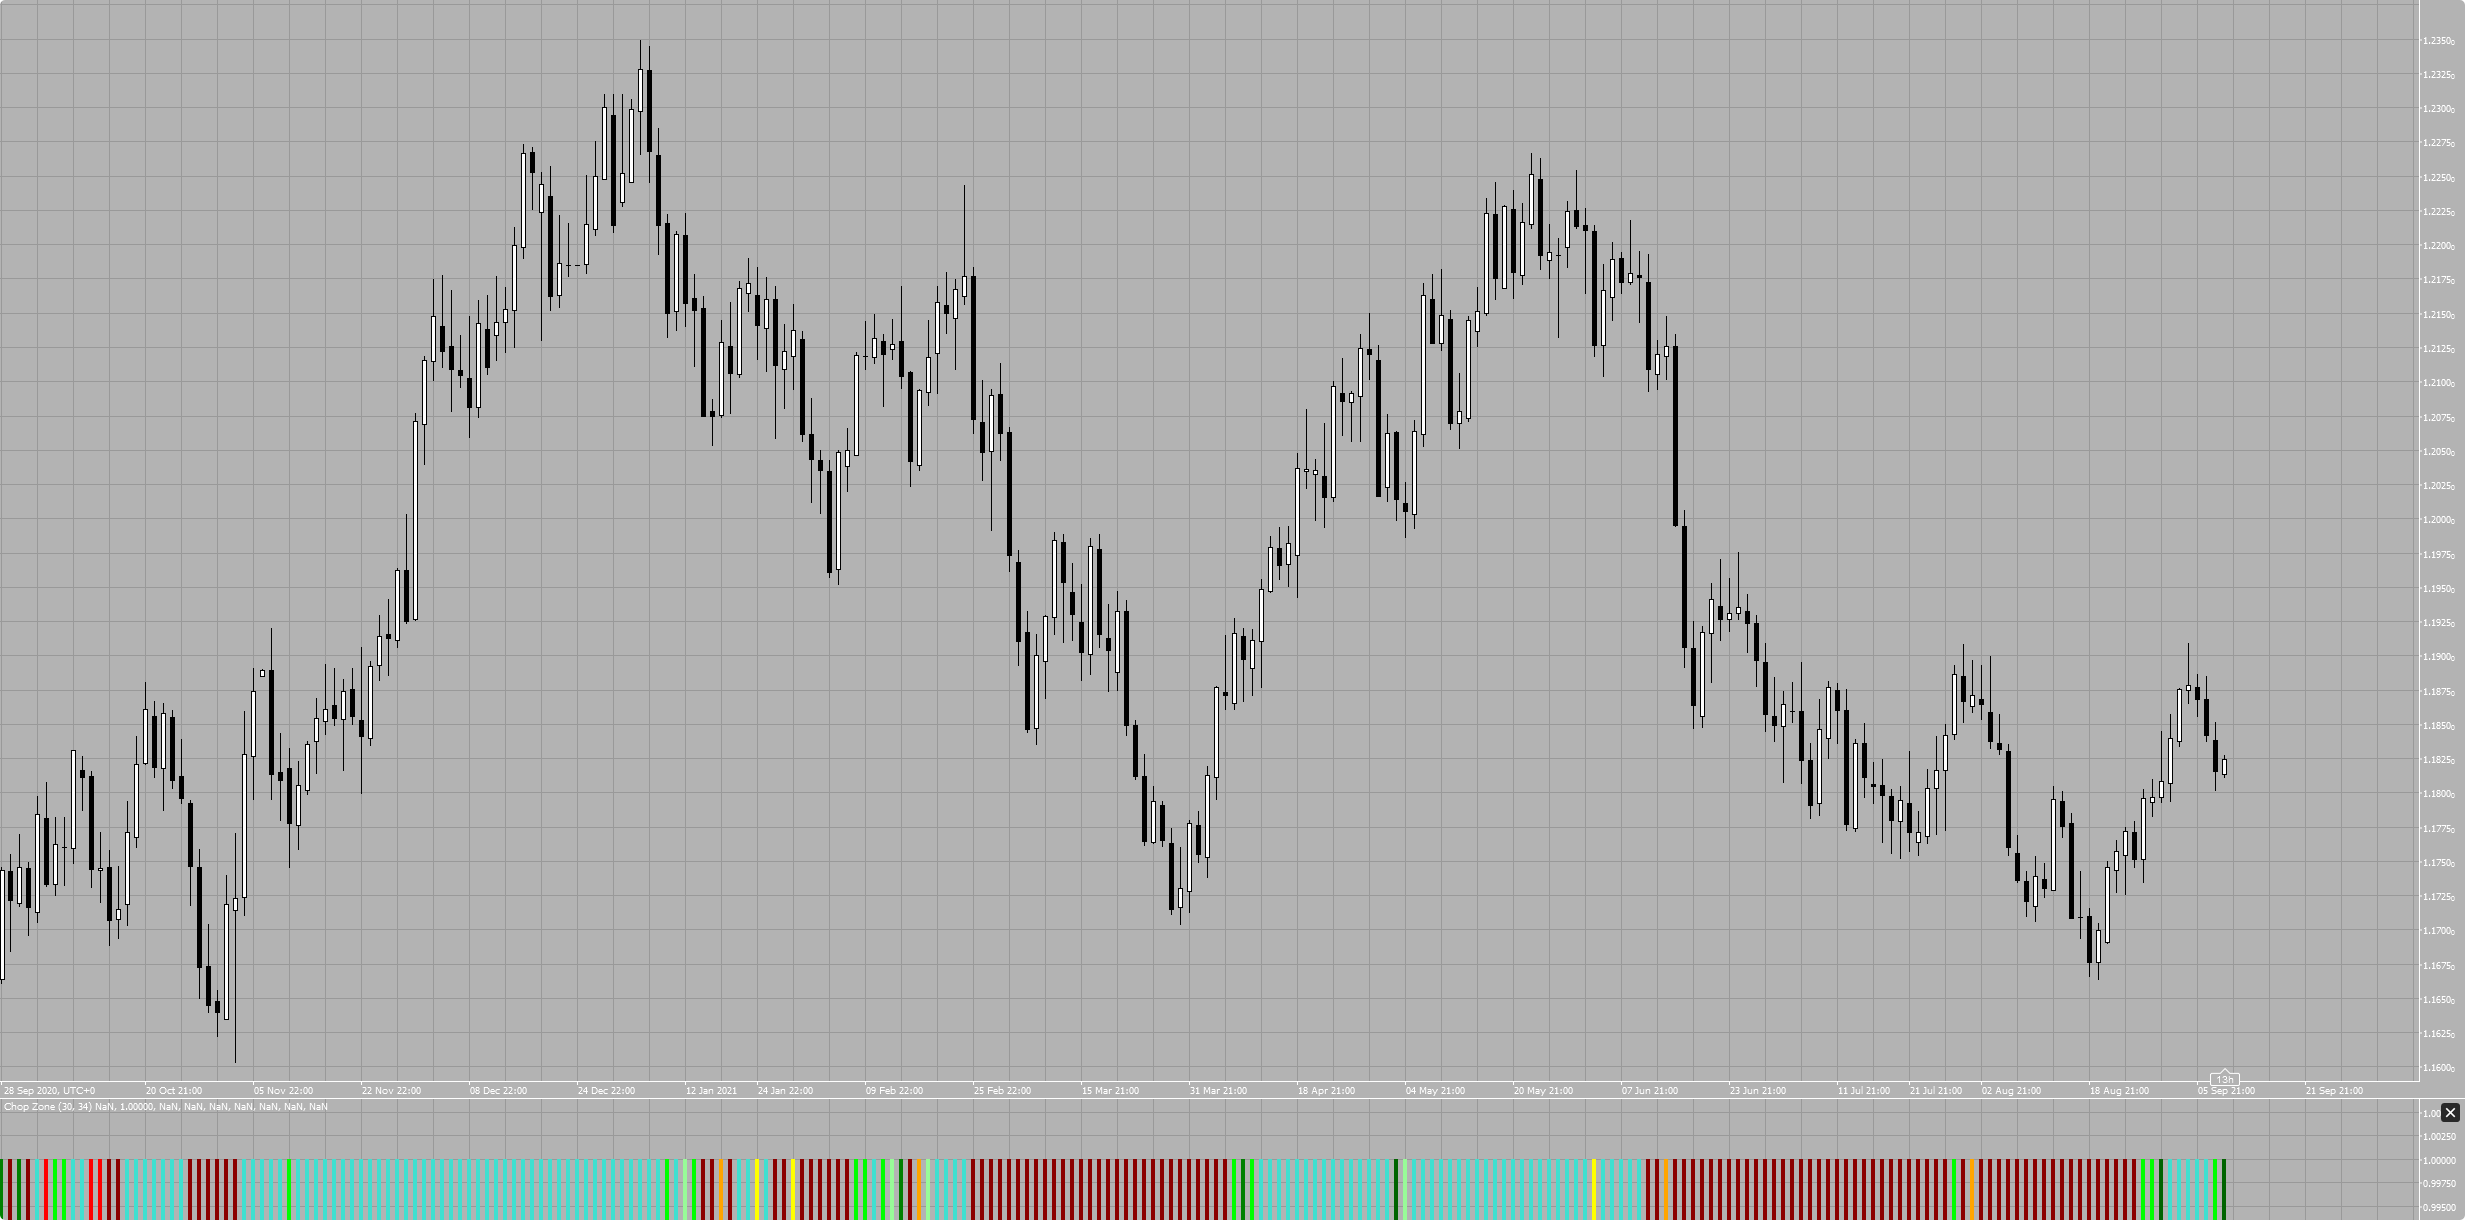
This indicator shows the market condition on a histogram, it measures the trendiness and choppiness of price action.
Github:

// -------------------------------------------------------------------------------------------------------------------------------------------
//
//    Chop Zone is a technical analysis indicator that shows how choppy the market is.
//    This is the Chop Zone custom indicator for cTrader based on Automate API.
//
// -------------------------------------------------------------------------------------------------------------------------------------------

using System;
using cAlgo.API;
using cAlgo.API.Indicators;

namespace cAlgo
{
    [Indicator(IsOverlay = false, TimeZone = TimeZones.UTC, AccessRights = AccessRights.None)]
    public class ChopZone : Indicator
    {
        private ExponentialMovingAverage _ema;

        [Parameter("Periods", DefaultValue = 30, MinValue = 1)]
        public int Periods { get; set; }

        [Parameter("EMA Periods", DefaultValue = 34, MinValue = 1)]
        public int EmaPeriods { get; set; }

        [Output("First", LineColor = "Turquoise", PlotType = PlotType.Histogram, Thickness = 4)]
        public IndicatorDataSeries First { get; set; }

        [Output("Second", LineColor = "DarkGreen", PlotType = PlotType.Histogram, Thickness = 4)]
        public IndicatorDataSeries Second { get; set; }

        [Output("Third", LineColor = "PaleGreen", PlotType = PlotType.Histogram, Thickness = 4)]
        public IndicatorDataSeries Third { get; set; }

        [Output("Fourth", LineColor = "Lime", PlotType = PlotType.Histogram, Thickness = 4)]
        public IndicatorDataSeries Fourth { get; set; }

        [Output("Fifth", LineColor = "DarkRed", PlotType = PlotType.Histogram, Thickness = 4)]
        public IndicatorDataSeries Fifth { get; set; }

        [Output("Sixth", LineColor = "Red", PlotType = PlotType.Histogram, Thickness = 4)]
        public IndicatorDataSeries Sixth { get; set; }

        [Output("Seventh", LineColor = "Orange", PlotType = PlotType.Histogram, Thickness = 4)]
        public IndicatorDataSeries Seventh { get; set; }

        [Output("Eighth", LineColor = "LightOrange", PlotType = PlotType.Histogram, Thickness = 4)]
        public IndicatorDataSeries Eighth { get; set; }

        [Output("Ninth", LineColor = "Yellow", PlotType = PlotType.Histogram, Thickness = 4)]
        public IndicatorDataSeries Ninth { get; set; }

        protected override void Initialize()
        {
            _ema = Indicators.ExponentialMovingAverage(Bars.ClosePrices, EmaPeriods);
        }

        public override void Calculate(int index)
        {
            var bar = Bars[index];

            var average = (bar.High + bar.Low + bar.Close) / 3;

            var highestHigh = Bars.HighPrices.Maximum(Periods);
            var lowestLow = Bars.LowPrices.Minimum(Periods);

            var range = 25 / (highestHigh - lowestLow) * lowestLow;

            var x1Ema = 0;
            var x2Ema = 1;
            var y1Ema = 0;
            var y2Ema = (_ema.Result[index - 1] - _ema.Result[index]) / average * range;

            var cEma = Math.Sqrt((x2Ema - x1Ema) * (x2Ema - x1Ema) + (y2Ema - y1Ema) * (y2Ema - y1Ema));

            var emaAngle = Math.Round(180 * Math.Acos((x2Ema - x1Ema) / cEma) / Math.PI);
            emaAngle = y2Ema > 0 ? -emaAngle : emaAngle;

            First[index] = double.NaN;
            Second[index] = double.NaN;
            Third[index] = double.NaN;
            Fourth[index] = double.NaN;
            Fifth[index] = double.NaN;
            Sixth[index] = double.NaN;
            Seventh[index] = double.NaN;
            Eighth[index] = double.NaN;
            Ninth[index] = double.NaN;

            if (emaAngle >= 5)
            {
                First[index] = 1;
            }
            else if (emaAngle < 5 && emaAngle >= 3.57)
            {
                Second[index] = 1;
            }
            else if (emaAngle < 3.57 && emaAngle >= 2.14)
            {
                Third[index] = 1;
            }
            else if (emaAngle < 2.14 && emaAngle >= .71)
            {
                Fourth[index] = 1;
            }
            else if (emaAngle <= -1 * 5)
            {
                Fifth[index] = 1;
            }
            else if (emaAngle > -1 * 5 && emaAngle <= -1 * 3.57)
            {
                Sixth[index] = 1;
            }
            else if (emaAngle > -1 * 3.57 && emaAngle <= -1 * 2.14)
            {
                Seventh[index] = 1;
            }
            else if (emaAngle > -1 * 2.14 && emaAngle <= -1 * .71)
            {
                Eighth[index] = 1;
            }
            else
            {
                Ninth[index] = 1;
            }
        }
    }
}
Spotware
Joined on 23.09.2013
- Distribution: Free
- Language: C#
- Trading platform: cTrader Automate
- File name: Chop Zone.algo
- Rating: 0
- Installs: 1986
- Modified: 13/10/2021 09:55
Note that publishing copyrighted material is strictly prohibited. If you believe there is copyrighted material in this section, please use the Copyright Infringement Notification form to submit a claim.
Comments
Log in to add a comment.
AB
It would be nice if there would be a "return" option so it could be used in / called from a bot. Also some description of the settings first - ninth would be nice.

It's basically the Price ROC in angle degrees sliced in 9 parts,,