Description
Hi, I'm a full-time IOS developer and a trader as well. I'm a trend trader. I found Heiken Ashi is one of the best trend indicators. then I found people feel difficulty to find the current price action on Heiken Ashi Candle because of the original candle hidden in the back of the Heiken ASHI candle. Heiken Ashi shows only the direction of a trend in the current time period, not the correct current price. that's why I decided to build a new modified version of it.
previous version:
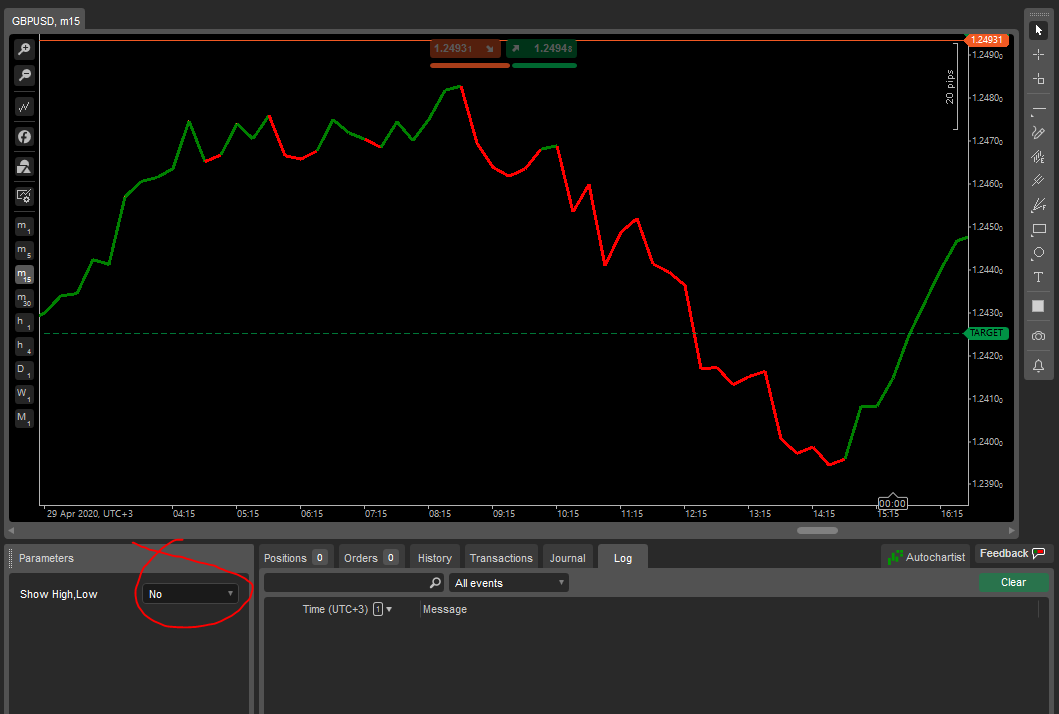
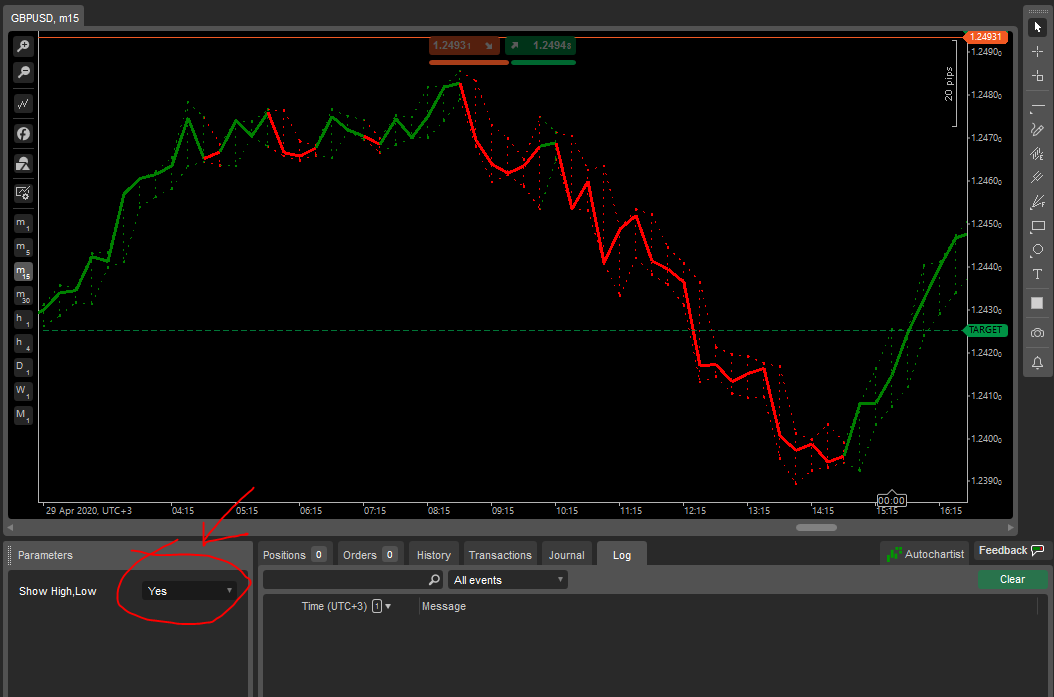
you can use it in two ways
way 1:

you can clearly see that it's only showing the price as line chart but price changes color based on Heiken Ashi trend change. that provide easiness to users so they can only focus on what they want to do with, trend direction + price action.
way 2:

if you are thinking that I've forgotten to add high and low prices, so here I'm back with another option you can change the parameter to add high and low prices to chart, now my chart is providing you the complete information as normal candlestick chart does. you can see high and low prices to identify the volatility.
how to calculate Heiken Ashi candle?
---------------------------------------------------------
HAopen = (previous HAopen + previous HAclose)/2
HAclose = (open+high+low+close)/4
HAhigh = Max(high,HAopen,HAclose)
HAlow = Min(low,HAopen,HAclose)
Note:-
don't use any indicator if you don't understand its mathematical Calculation.
Youtube:
use this indicator with the combination of this EA
Please feel free to visit my profile:
Fiverr:
==================================
linkedin: https://www.linkedin.com/in/zunisoft/
whatsapp: +923074194244
call: +923360550104
facebook: web.facebook.com/uog.nabeel
using System;
using cAlgo.API;
using cAlgo.API.Internals;
using cAlgo.API.Indicators;
using cAlgo.Indicators;

namespace cAlgo
{
    [Indicator(IsOverlay = true, TimeZone = TimeZones.UTC, AccessRights = AccessRights.None)]
    public class TrendZonePrice : Indicator
    {
        ////////////////////////////////////////////////////////
        ////////////////////////////////////////////////////////
        ////////////////  Variables ...........................!
        ////////////////////////////////////////////////////////


        [Parameter("Show High,Low", DefaultValue = true)]
        public bool showHL { get; set; }


        private IndicatorDataSeries _haOpen;
        private IndicatorDataSeries _haClose;
        private IndicatorDataSeries _haHigh;
        private IndicatorDataSeries _haLow;


        ////////////////////////////////////////////////////////////////////////
        ////////// initializer ................................................!
        ////////////////////////////////////////////////////////////////////////

        protected override void Initialize()
        {
            _haOpen = CreateDataSeries();
            _haClose = CreateDataSeries();
            _haHigh = CreateDataSeries();
            _haLow = CreateDataSeries();
        }


        /////////////////////////////////////////////////////////////////////////
        /////// Calculation ....................................................!
        /////////////////////////////////////////////////////////////////////////


        public override void Calculate(int index)
        {
            var open = Bars.OpenPrices[index];
            var high = Bars.HighPrices[index];
            var low = Bars.LowPrices[index];
            var close = Bars.ClosePrices[index];
            var time = Bars.OpenTimes[index];

            var haClose = (open + high + low + close) / 4;
            var haOpen = (index > 0) ? (_haOpen[index - 1] + _haClose[index - 1]) / 2 : (open + close) / 2;
            var haHigh = Math.Max(Math.Max(high, haOpen), haClose);
            var haLow = Math.Min(Math.Min(low, haOpen), haClose);

            _haOpen[index] = haOpen;
            _haHigh[index] = haHigh;
            _haLow[index] = haLow;
            _haClose[index] = haClose;

            Chart.ChartType = ChartType.Line;
            var clr = haClose > haOpen ? "green" : "red";
            Chart.DrawTrendLine("line" + index, Bars.OpenTimes[index - 1], Bars.ClosePrices[index - 1], time, close, clr, 3);

            if (showHL)
            {
                Chart.DrawEllipse("high" + index, time, high, time, high, clr, 3);
                Chart.DrawEllipse("low" + index, time, low, time, low, clr, 3);

                Chart.DrawTrendLine("verticle" + index, time, high, time, low, clr, 1, LineStyle.DotsVeryRare);
                Chart.DrawTrendLine("upperline" + index, Bars.OpenTimes[index - 1], Bars.HighPrices[index - 1], time, high, clr, 1, LineStyle.DotsVeryRare);
                Chart.DrawTrendLine("lowerline" + index, Bars.OpenTimes[index - 1], Bars.LowPrices[index - 1], time, low, clr, 1, LineStyle.DotsVeryRare);
            }
        }


    }
}
ZuniSoft
Joined on 11.03.2019
- Distribution: Paid
- Language: C#
- Trading platform: cTrader Automate
- File name: TrendZone Price.algo
- Rating: 5
- Installs: 1705
- Modified: 13/10/2021 09:54
Comments
How can this be used in a cBot?
Wellcome. hope you are doing well.
Gracias por tu ayuda.

i have a good indicator in another format language..i give you base calculation of formula can you code it for me please