Warning! This section will be deprecated on February 1st 2025. Please move all your Indicators to the cTrader Store catalogue.
Description
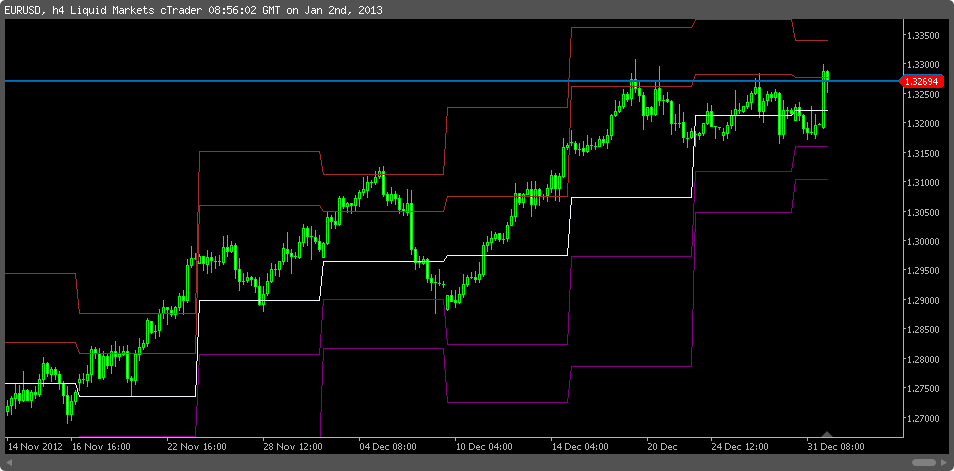
The most common method in calculating pivot points is the 5 point pivot system.
This indicator calculates and display pivot levels for daily, weekly and monthly timeframes.
FEATURES:
-Works on all timeframes
-Paramterable display of daily, weekly and monthly pivots
HI
hichem
Joined on 17.12.2012
- Distribution: Free
- Language: C#
- Trading platform: cTrader Automate
- File name: Ultimate 5 points pivot system.algo
- Rating: 5
- Installs: 7036
- Modified: 13/10/2021 09:54
Note that publishing copyrighted material is strictly prohibited. If you believe there is copyrighted material in this section, please use the Copyright Infringement Notification form to submit a claim.
Comments
Log in to add a comment.
Actually this indicator has the same problem as all other cTrader pivot indicators here - it will not draw the pivots correctly on tick charts (and likely on other non-minute/ time based charts)
Consider using the new TimeFrame class and property.

I have been told by a programmer that there is an issue with cTrader Pivots and unfortunately, it seems like it can't be solved.
Market Data Series containing candle stick info is what makes one able to draw a line on the chart representing the Pivot. There is no way to get a Market Data Series based candle in tick charts or any time-based chart below 1 minute and for this reason there is no way to get the correct info on cAlgo API and draw correct Pivots on tick charts or any time-based charts below 1M!!
Please let me know if you think you have a solution to this problem!!