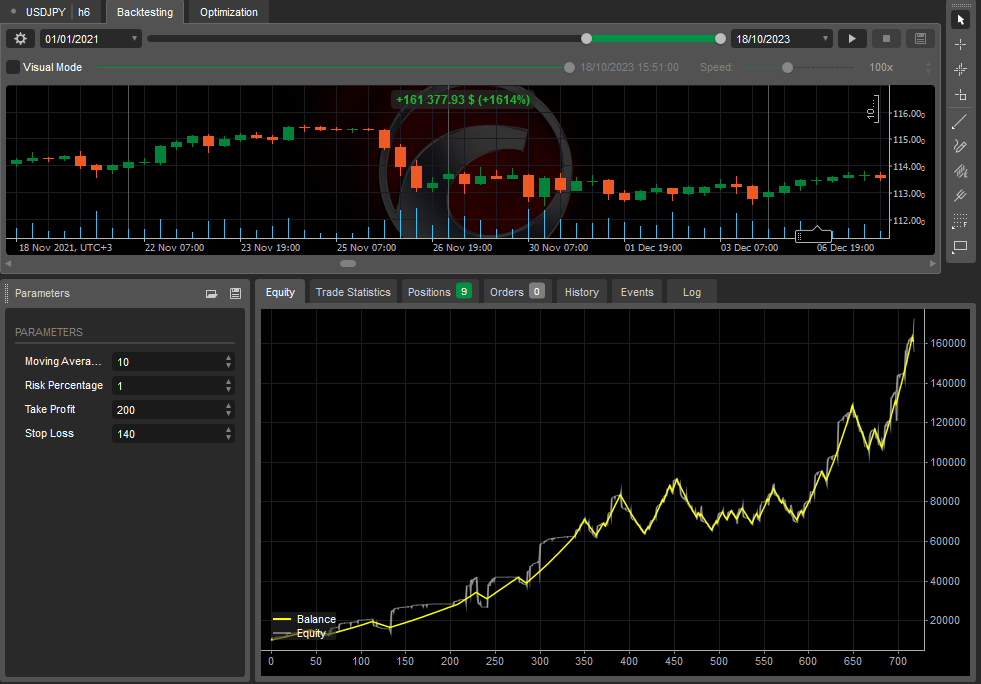
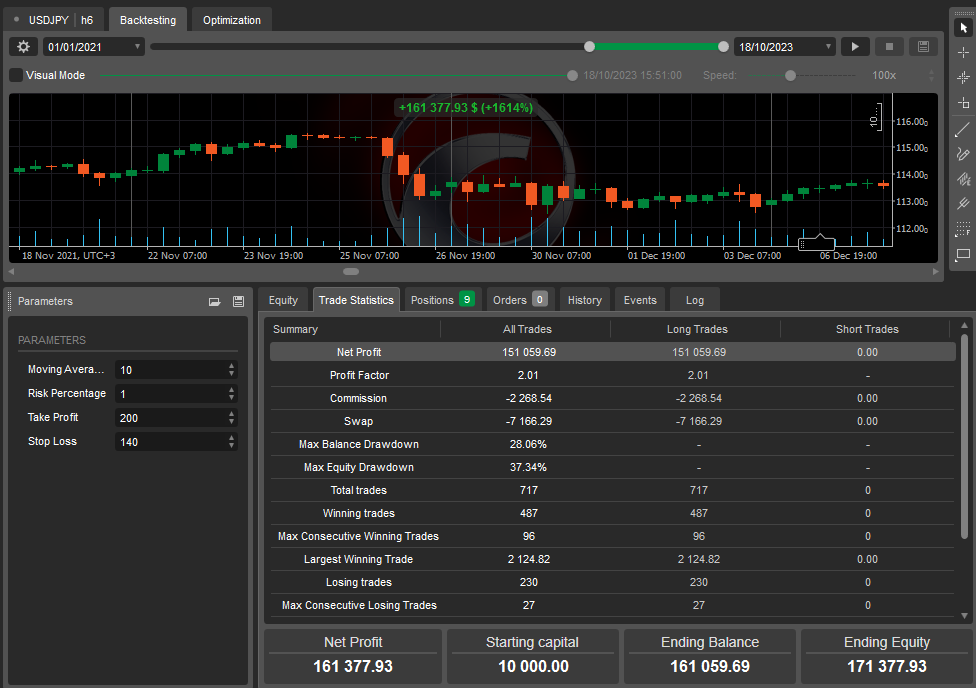
Description
The RS Sniper trading strategy is designed to be a straightforward yet powerful approach for identifying and executing trading opportunities . This strategy relies on a well-defined technical indicator, the Simple Moving Average (SMA), to determine potential entry points for trades. The SMA is used to smooth out price data and provide a clearer picture of the underlying trend.
The RS Sniper strategy specifically focuses on identifying potential buying opportunities. It does so by comparing the most recent closing price of the USDJPY to the value of the SMA. Once the RS Sniper detects a suitable condition, it takes action by executing a market order.
Risk Management: Percentage-Based Position Sizing
The algorithm acknowledges the importance of risk management in trading. Rather than using a fixed quantity for each trade, it calculates the trade quantity as a percentage of the account balance. This means that the amount invested in each trade is adjusted based on the available capital, ensuring that a significant portion of the account is not risked on a single trade.
By incorporating the SMA for entry signals and implementing percentage-based position sizing for risk management, the RS Sniper trading strategy aims to strike a balance between simplicity and effectiveness in identifying buying opportunities while mitigating risk. This combination makes it a valuable tool for traders looking for a structured and systematic approach to trading in financial markets.
Defaults:
- Take Profit: 200 pips
- Stop Loss: 140 pips
- MA Period: 10
- Risk Percentage: 1%
THE STRATEGY IS ADAPTED TO THE USDJPY 6 HOUR CANDLES
3 YEAR (JAN 2021 - OCT 2023) RETURN 1600%+
Contact: WhatsApp
Email: pierrekungu.trading@gmail.com
Use at your own risk!!
CHECK OUT OTHER CBOTS
PAID
- USDJPY 1D 1300%+ 3-YEAR return (DAILY CANDLES)
FREE BOTS


The author decided to hide the source code.
peter_kungu
Joined on 01.06.2023
- Distribution: Paid
- Language: C#
- Trading platform: cTrader Automate
- File name: Risk Control Sniper.algo
- Rating: 0
- Installs: 0
- Modified: 18/10/2023 13:30
Comments
I know you don't specifically mention in the preamble, but; are you using m1 bar data, or tick data for your back-testing. I've noted it numerous times that m1 bar data will give apparently stunning results only to be confounded when trading live. However, if using tick data, the results are in a very similar ballpark +/-5%.
Apologies if this sounds condescending, but was curious to know what data was used for the back-tests as this will vary wildly in reality if m1 bar data is used.

Hello, my strategies are longer term and not intended for scalping. This strategy is optimized for 6 hour candles based which is not sensitive to rapid price changes. As such, I use OnBar for entries.